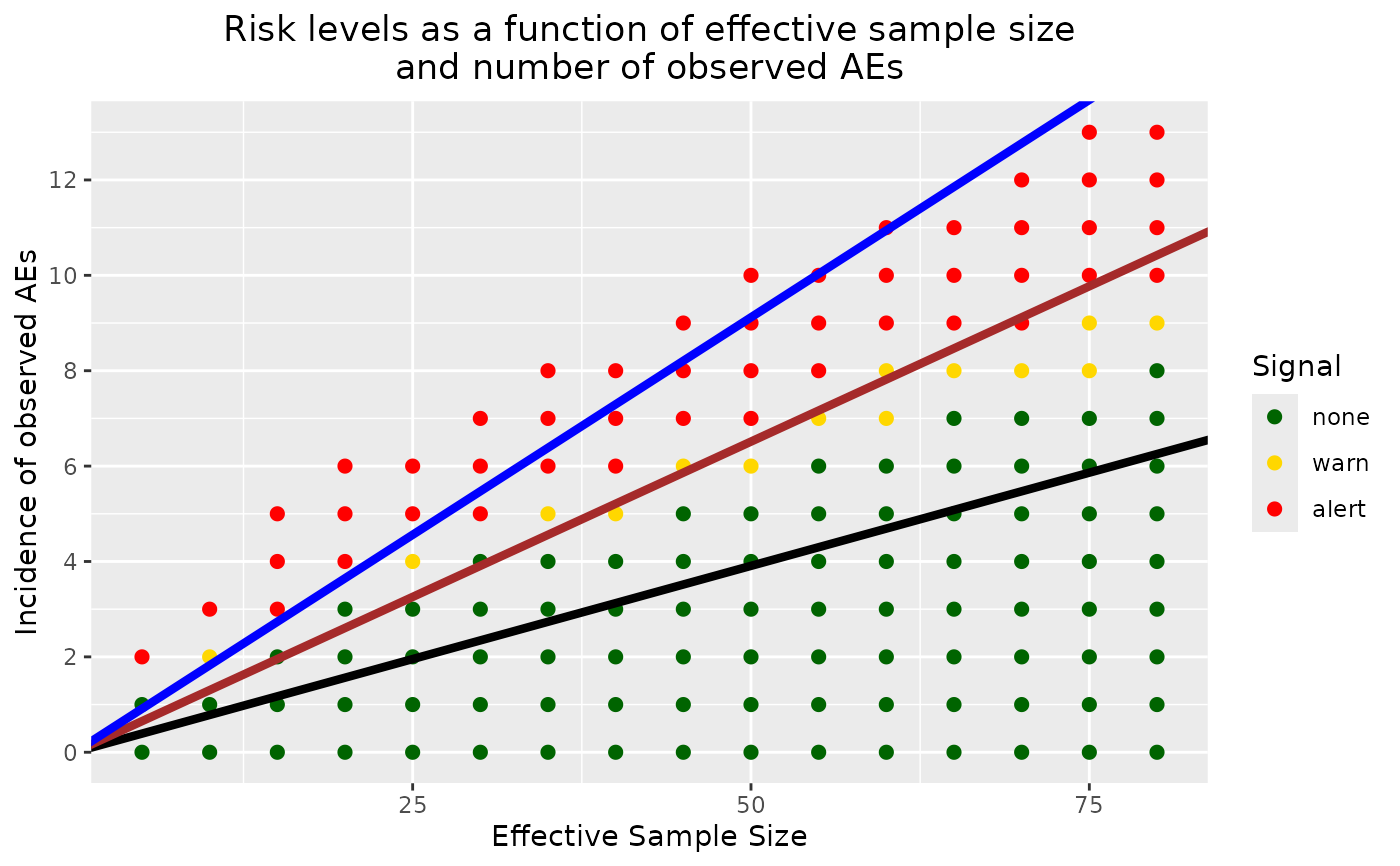
Graphical representation of potential safety signal detection for a given ongoing trial sample size.
Source:R/approx_bssd_graph.R
approx_bssd_graph.RdThis function creates a graph that represents all possible occurrences of observed events for an ongoing trial given a fixed sample size. The x-axis represents the number of participants (also equivalent to time since time can be expressed in a completed-trial-participant unit). The y-axis represents the number of participants with one AE. Risk levels, i.e., Pr(active AE rate > placebo AE rate), are expressed via color coding: green, yellow, and red representing risk levels that would warrant no action, a warning, and an alert, respectively. These three levels are delimited by thresholds of 80% and 90%. This function assumes that all the enrolled patients are completers (no dropout).
Usage
approx_bssd_graph(
  time,
  prob_arm1,
  pi1_alpha,
  pi1_beta,
  pi2_alpha = 0.3,
  pi2_beta = 0.3,
  num_samples = 50000
)
Arguments
- time
numeric, total time at risk (units = study duration). It can also be construed as the actual number of participants in the ongoing trial, and not the effective number of patients. This parameter expects a positive whole number.
- prob_arm1
numeric, probability of being randomized to placebo (arm1).
- pi1_alpha
numeric, first shape param of beta prior distribution on unit-time event probability in placebo (arm1).
- pi1_beta
numeric, second shape param of beta prior distribution on unit-time event probability in placebo (arm1).
- pi2_alpha
numeric, first shape param of beta prior distribution on unit-time event probability in active (arm2).
- pi2_beta
numeric, second shape param of beta prior distribution on unit-time event probability in active (arm2).
- num_samples
integer, number of replication of the simulated samples. More is better, up to a point. The default is 50000 and gives robust estimations of Pr(active AE rate > placebo AE rate). This parameter can be changed to a smaller number to fasten the computation time, but the estimation will be less accurate.
Value
A ggplot object showing the estimated probability that the
adverse-event rate in the active arm is greater than that in the placebo
arm for each possible number of observed participants with an adverse
event, given the specified total time at risk. Probability levels are
represented by color coding in the plot.
Examples
# Note: Set seed for reproducible graph.
set.seed(2021)
approx_bssd_graph(
  time = 80, prob_arm1 = 1 / 3,
  pi1_alpha = 151.3025005, pi1_beta = 1784.3675521, pi2_alpha = 0.3,
  pi2_beta = 0.3, num_samples = 1000
)