server <- function(input, output, session) {
  data <- reactive({
    req(input$file)
    name <- input$file$name
    path <- input$file$datapath
    ext <- tools::file_ext(name)
    switch(ext,
      csv = vroom::vroom(path, ","),
      tsv = vroom::vroom(path, "\t"),
      validate("Invalid file")
    )
  })

  output$head <- renderTable({
    head(data(), input$n)
  })
}7 Shiny Development
openstatsware Course: Good Software Engineering Practice for R Packages
Ryan
September 26, 2023
Why are best practices important for Shiny?
- Shiny is in itself more complex than usual R code
- Small apps can quickly evolve into giant apps
- It seems first possible to test everything by hand, clicking around
- For one-off, throw-away, one-screen Shiny apps that is ok
- Here we talk about best practices for more-than-once used Shiny apps
Design
Design: Collaborate with your customer
- Involve your customer from the first ideation
- Identify the roles and responsibilities
- Make reasonable assumptions about user skills and knowledge
- Show early wireframes, prototypes, beta versions and get feedback
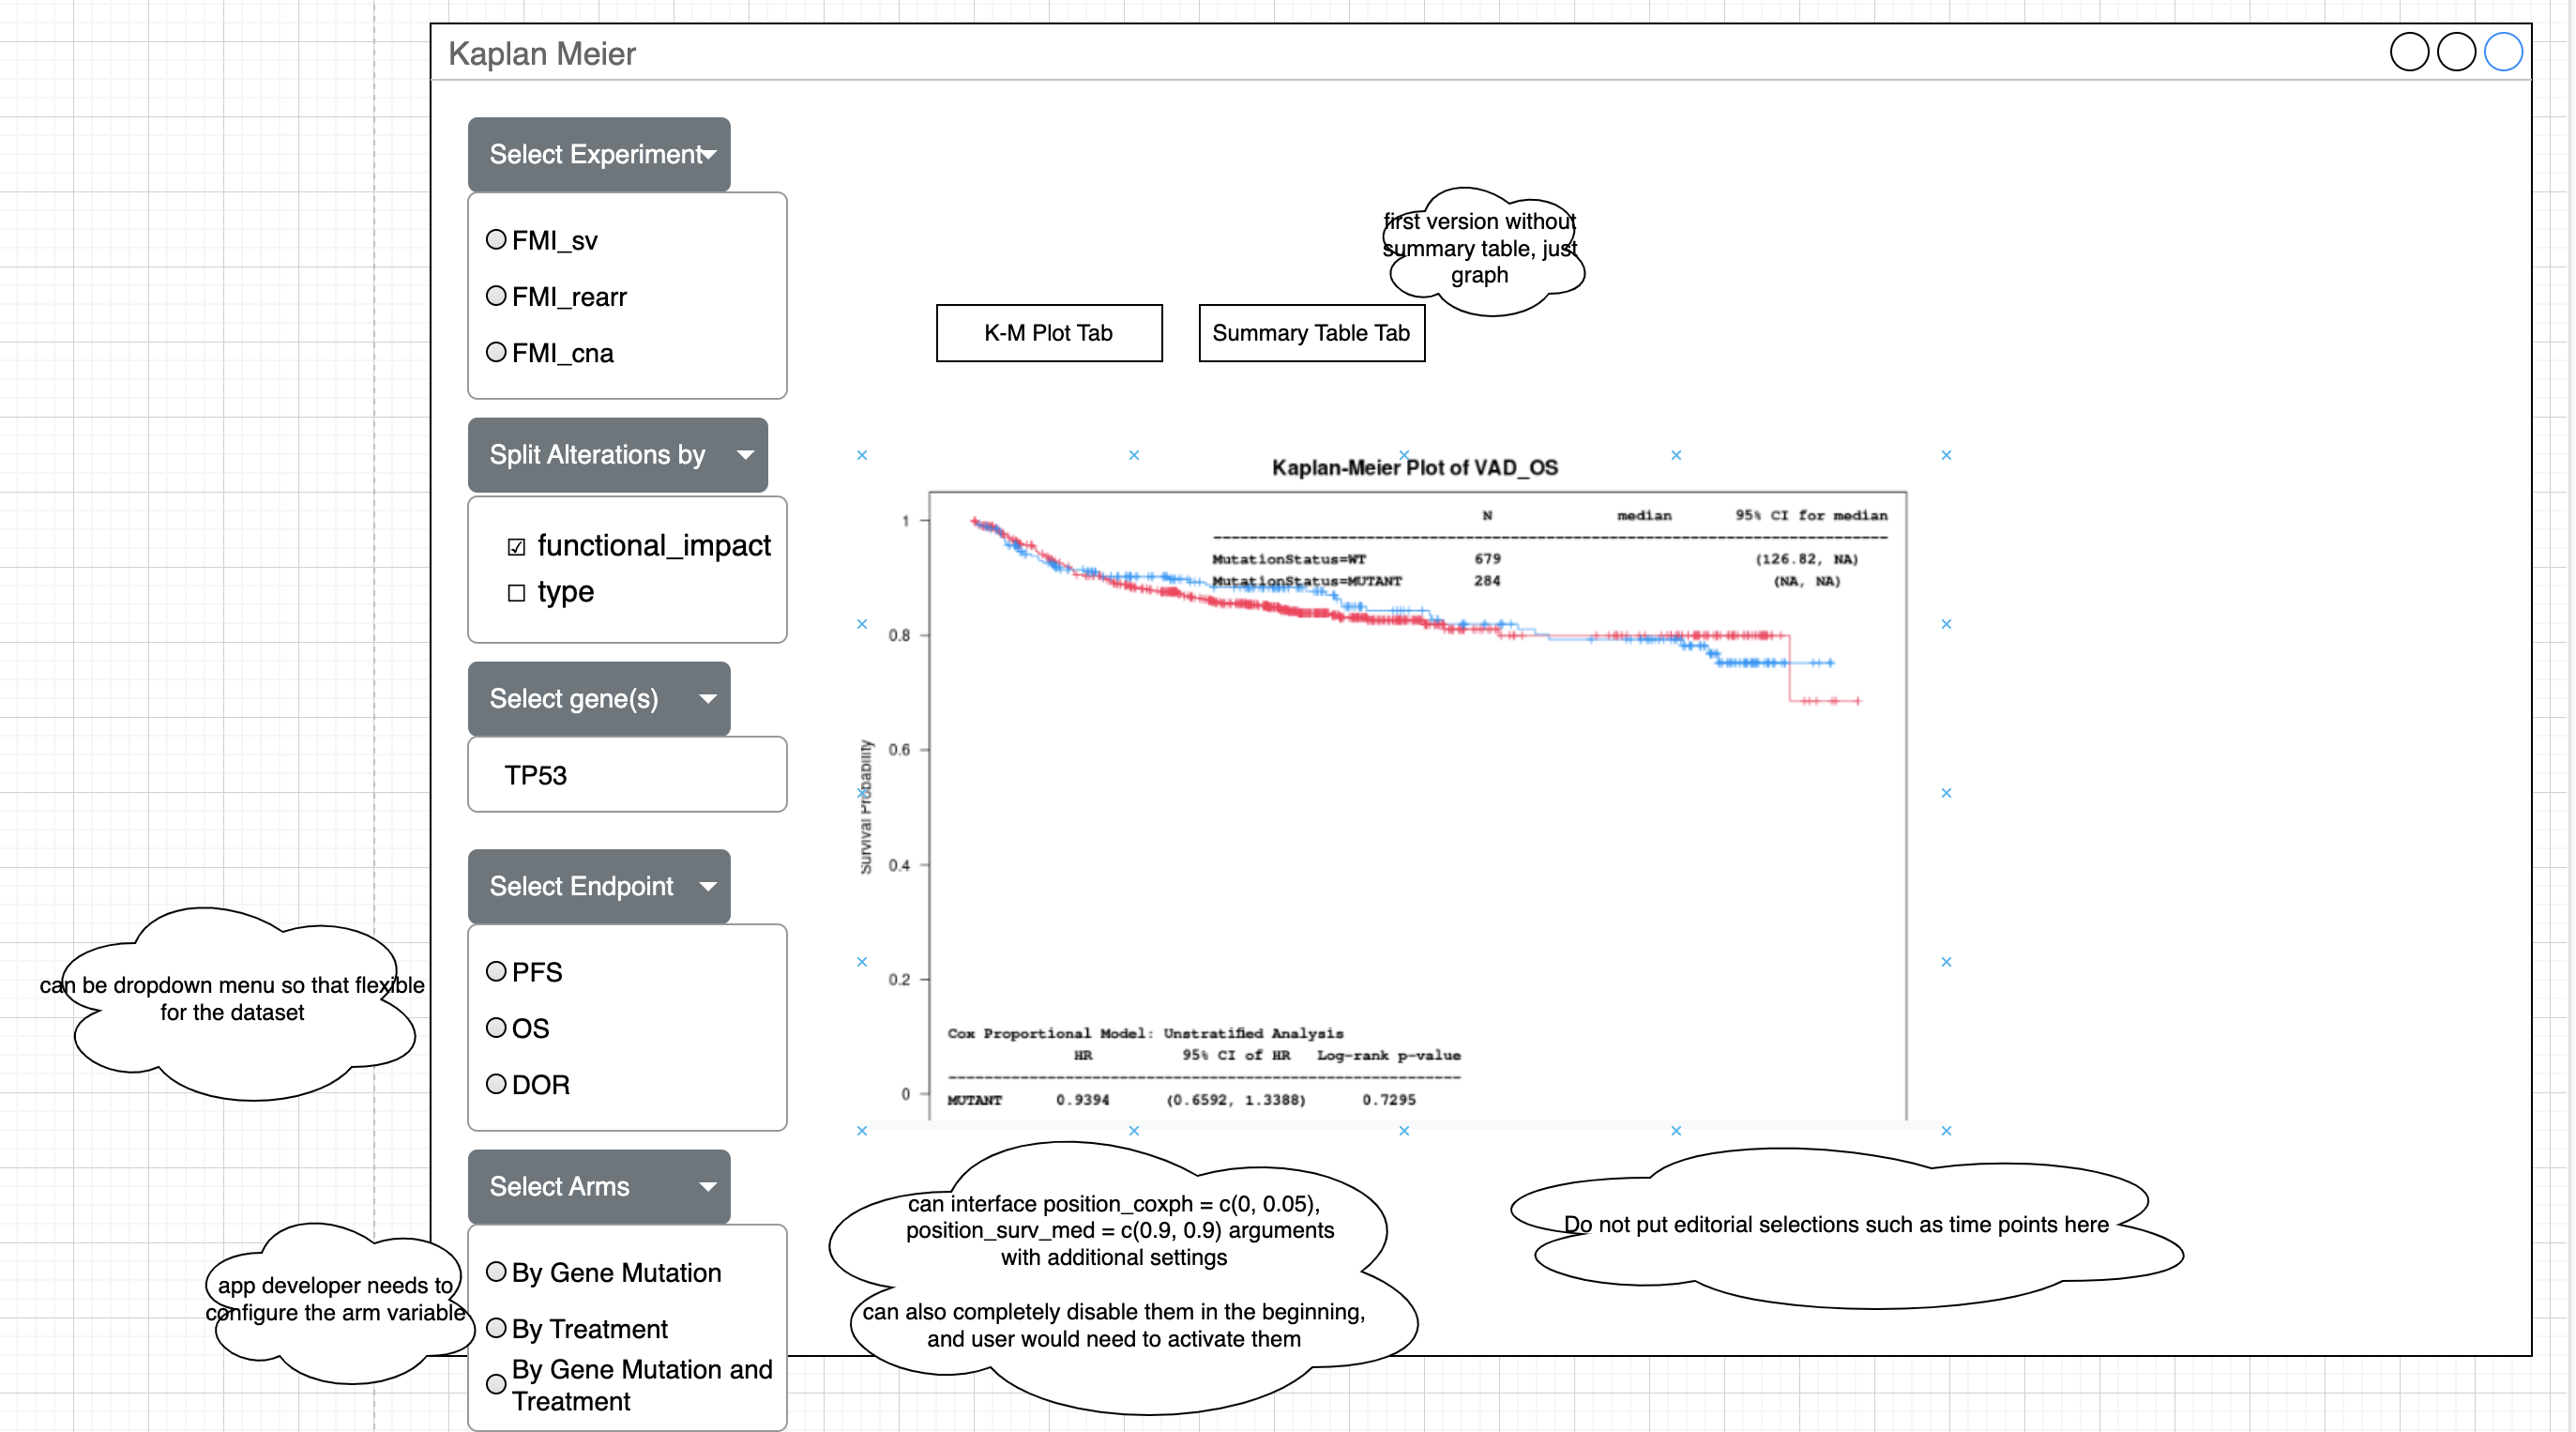
UI Design: Wireframing
UI Design: Example wireframe
Architecture
Architecture: Minimize code in Shiny
- Minimize the code inside the Shiny UI/server
- Because it will always be easier to test things that live outside of Shiny
- Let’s look at an example from the Mastering Shiny book
Minimize Shiny Example: Before
The ext and switch() part validates the file extension and then loads the file.
Independent of Shiny reactive!
Minimize Shiny Example: After
load_file <- function(name, path) {
  ext <- tools::file_ext(name)
  switch(ext,
    csv = vroom::vroom(path, ","),
    tsv = vroom::vroom(path, "\t"),
    validate("Invalid file")
  )
}

server <- function(input, output, session) {
  data <- reactive({
    req(input$file)
    load_file(
      input$file$name,
      input$file$datapath
    )
  })

  output$head <- renderTable({
    head(data(), input$n)
  })
}
normal function,
validate()will give a simple error outside of Shinyserver is much easier to read now and only half the size
can test
load_file()interactively in consolecan unit tests
load_file()separately (business as usual)
Minimize Shiny: Separate packages
- On the macro level, this also applies to packages
- Larger Shiny apps will need to live as an R package
- The business logic best lives in another R package
- That package can then also be used without the Shiny interface
- You can use
{staged.dependencies}to allow “joint” pull requests - Example from the
NESTpackage ecosystem:{teal.modules.clinical}as the Shiny package{tern}as a business logic package
Modules
Modules: Building blocks of the Shiny app
- Shiny modules generalize functions
- Allows to coordinate UI and server code
- Breaks the app code into reusable and testable units
- Let’s look at an example from the Mastering Shiny book
Modules Example: Before
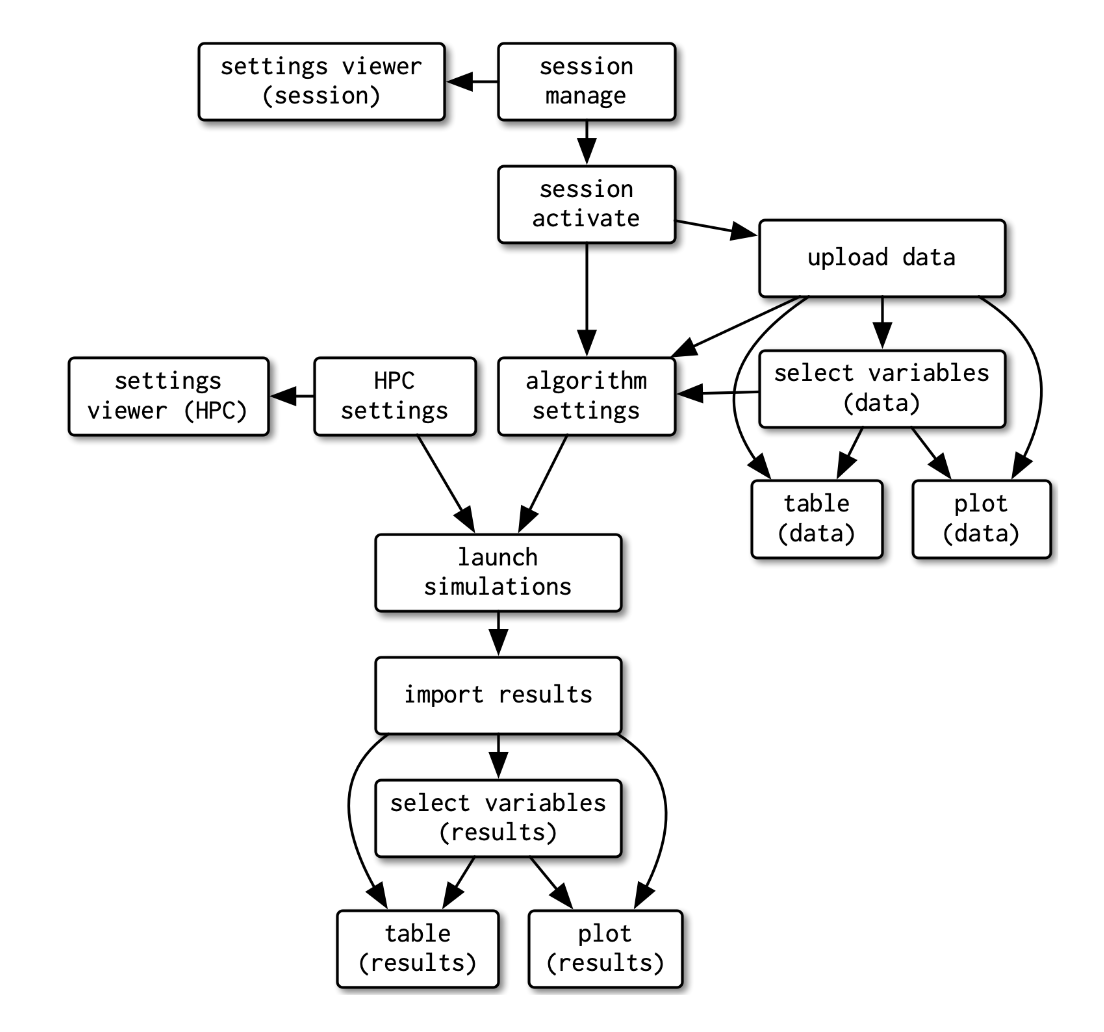
- Difficult to understand what is going on
- Need longer names / parentheses to differentiate tables / plots / variables in different places
- Hard to test
Modules Example: After
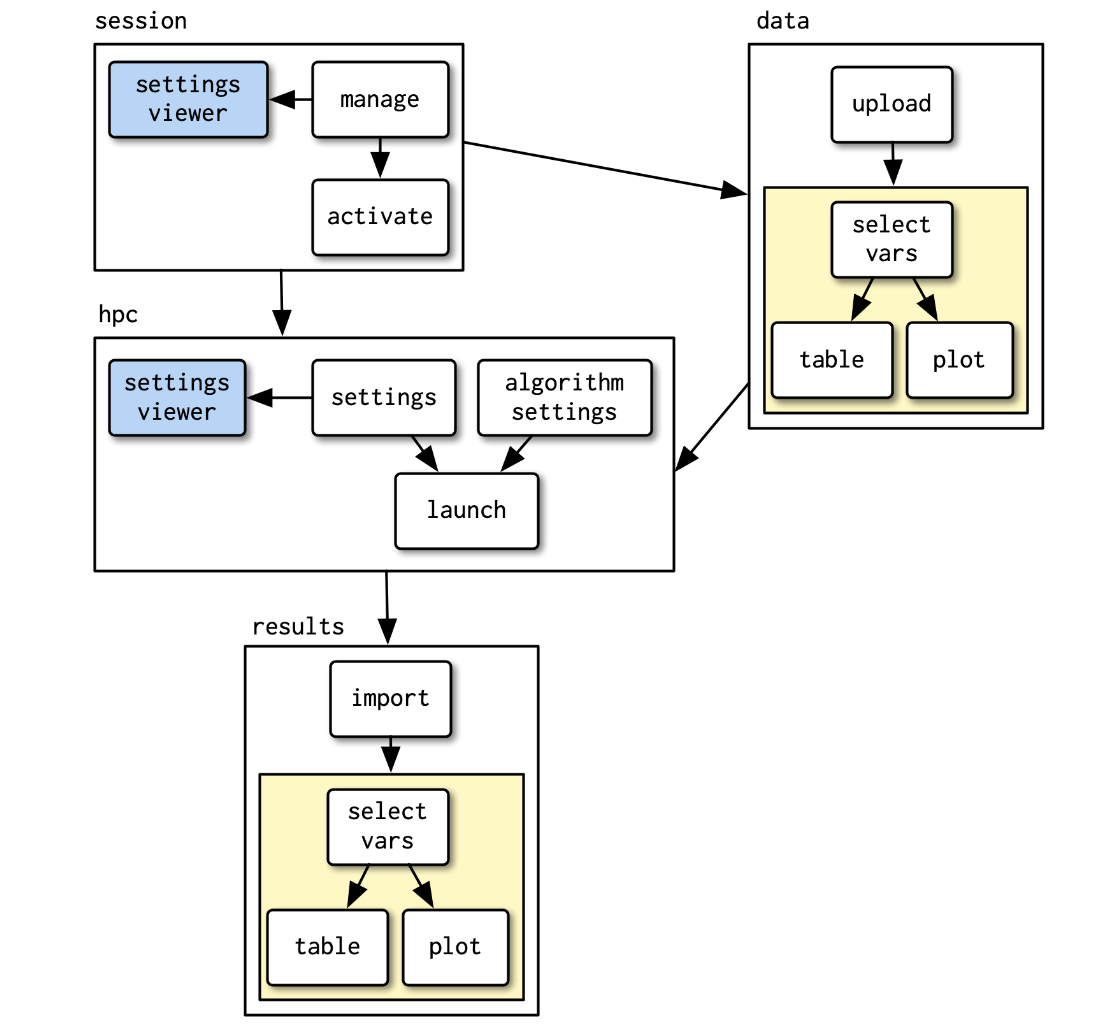
- Can easily see the 4 different parts of the app
- Naming becomes simpler for vars / tables / plots
- Can reuse the modules separately in other apps
- Can test the modules separately
Modules: Considerations similar to Functions
- What should be configurable?
- Think about reuse needs for module
- How to organize arguments?
- Use consistent naming conventions
- Keep the right order of the arguments
- Avoid dependencies between arguments
- Use instead parameter object pattern
- How to write good and maintainable code?
- Follow all the clean code rules from the previous chapter!
Reactivity
Reactivity
When building production shiny apps you won’t get around learning reactivity.
Some guidance:
- Keep user interface simple → often keeps reactivity simple → often less confusing to user
- Resolve reactive inputs early on & validate generously
- Design towards “stringy” reactivity graphs
- Don’t interrupt reactivity
- Preferably use
reactiveoverreactiveValuesobserveEventoverobserve
Reactivity: Resolve early & validate
server <- function(input, output, session) {
  output$plot <- renderPlot({
    # Resolve reactive values.
    xvar <- input$xvar
    yvar <- input$yvar
    req(xvar, yvar)

    # Validate – is it likely that the plot will be meaningful?
    validate(
      need(xvar %in% names(df), glue("xvar \"{xvar}\" does not exist")),
      need(yvar %in% names(df), glue("yvar \"{yvar}\" does not exist")),
      need(nrow(df) > 3, "too few data points for meaningful plot")
    )

    my_special_plot(df[[xvar]], df[[yvar]])
  })
}
Reactivity: Debugging techniques
- Put
browser()into the functions - Jump into browser mode upon error with
options(shiny.error = browser) - Just put
print()inside the reactives - Save variables to global environment via
.GlobalEnv$var <- varand then check - Simplify things until it works and then go back
Reactivity: Graph visualization
To understand the order of execution we can visualize the reactive graph, which describes how sources and endpoints are connected via conductors.
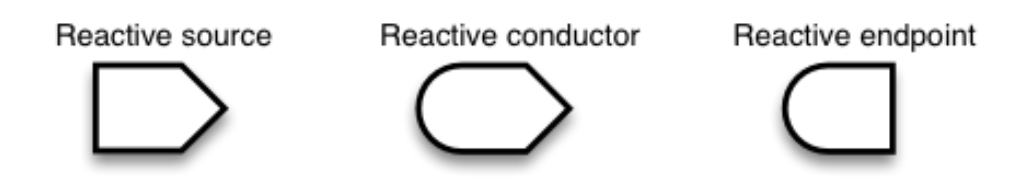
e.g. input
e.g. reactive
e.g. output
Reactivity: “Stringy” reactivity graph
Bad  Many edges, difficult to anticipate reactivity behaviour
Good 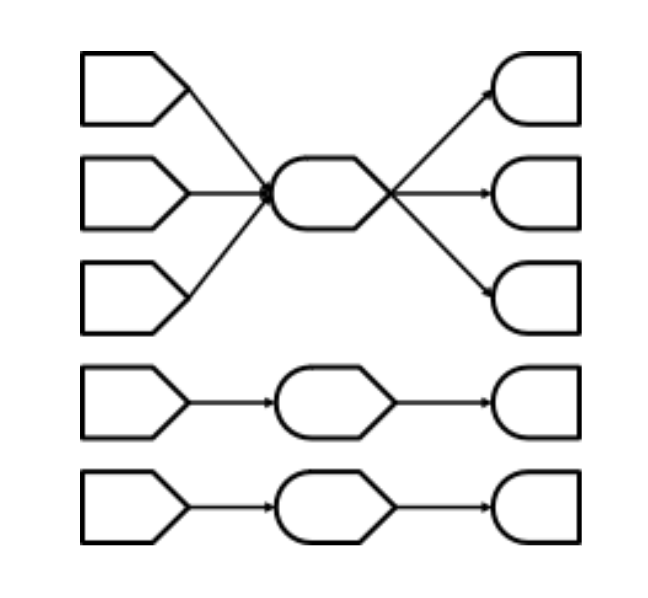 This “stringy” reactivity graph is easier to understand and debug
Testing
Testing: From Icecream to Pyramid
Bad
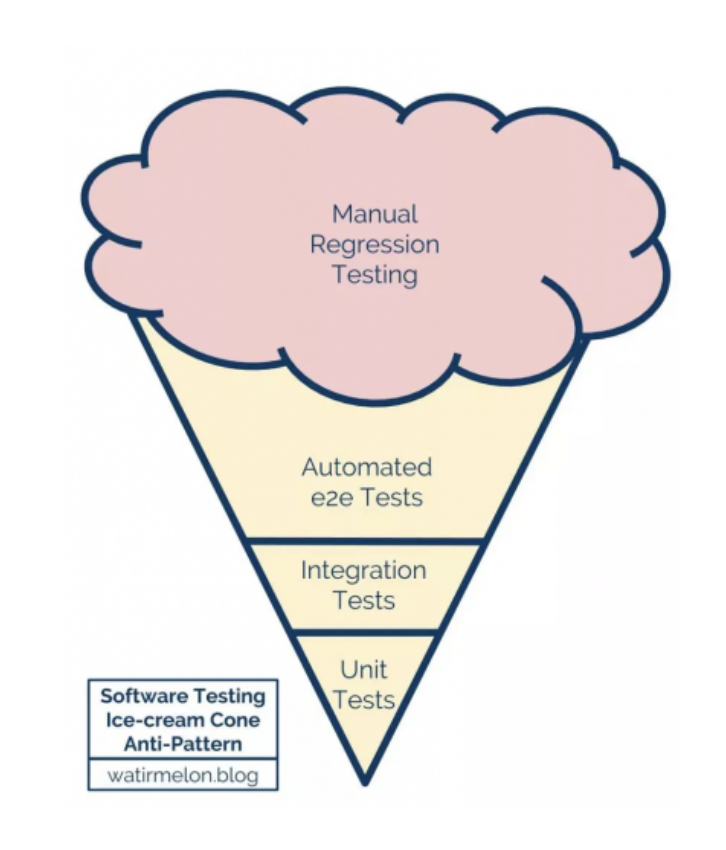
- cannot always test manually
- can easily introduce bugs
Good
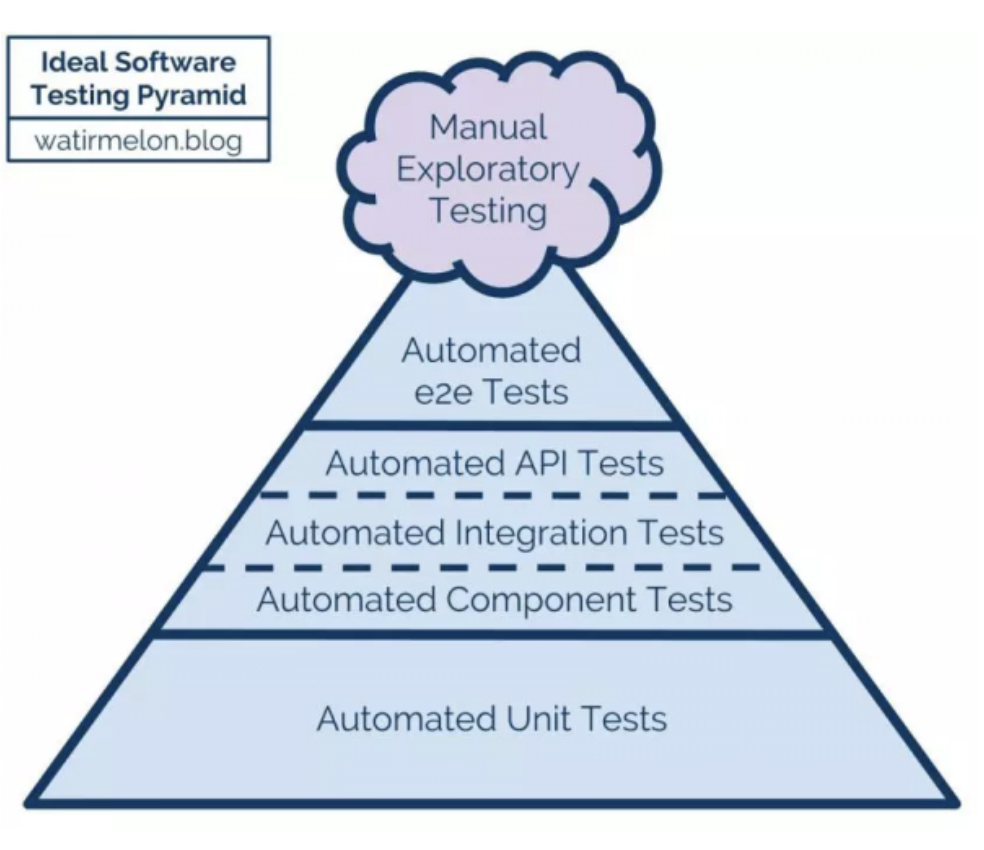
- manual testing is reduced
- only for “playing around”
Testing: Snapshot tests for UI
- Shiny UI functions return
shiny.tagobjects which print as HTML code - Can use snapshot tests to avoid accidental changes
- Value is limited
- Can create issues sometimes (non-reproducible hashes)
Testing: Shiny server tests
- Code is run inside the server function
- Can access reactives, outputs, etc.
- Session object simulates user actions and time
- Note: need to insert
browser() - Also works for module server functions
- Limitation: No UI, no JavaScript
Testing: Shiny app tests
library(shinytest2)
test_that("my app works", {
  app <- AppDriver$new(
    app_dir = "myAppDir",
    load_timeout = 1e5,
    variant = platform_variant()
  ) # app$get_logs()
  app$wait_for_idle(timeout = 1e5)
  app$get_screenshot()
  app$set_inputs(name = "Hadley")
  app$get_value("greeting")
  app$click("reset")
  app$get_value("greeting")
})- Usually the app is defined in
myAppDir/app.R - New app instance
appfromAppDriver$new() - Full Shiny app in a headless
chromotebrowser - Can look into it via
app$get_screenshot() - We can set inputs, get values of inputs/outputs, click buttons etc.
Additional Topics
Security
- Never include passwords in your source code! Instead:
- Use environment variables
- Or use the
{config}package - Any files containing passwords must be added to
.gitignore
- For user authentication, start with existing solutions that are IT approved
- Code run in
server()is isolated and cannot be seen by other users- But global environment, e.g. options, are shared across sessions
- Check all user input via assertions or validations to avoid JavaScript hacking
Packaging
The app should live in an R package. Why? Because we need:
- Metadata and dependencies: from
DESCRIPTION+NAMESPACEfiles - Code split into functions and modules: in files in the the
Rdirectory - Documentation via vignettes,
README, and function and modules documentation - Automated tests: using
testthatand the nativeR CMD check - Able to share the package as tarball or via repositories for installation
Deployment Options
- https://www.shinyapps.io/
- Allows for quick sharing of Shiny apps on the cloud
- Free version is good for quick tests or experiments
- Serious use needs subscription
- Internal Posit Connect is internal alternative
- More features than above cloud service
- One detail example: can use environment variables
- See https://posit.co/products/open-source/shinyserver/ for the differences
Deployment Process
You’ll need few extra steps:
Instruct the server how to run the app in the package. Simplest is
app.Rin package root folder containing:Ignore the
app.Rfor package buildInclude
shinyandpkgloadto theImportsin theDESCRIPTIONfileRun
rsconnect::deployApp()to share the updated app version!
References
- Adrian Waddell, Pawel Rucki, Daniel Sabanes Bove (2022). Lessons for designing scalable and maintainable Shiny apps Tutorial at useR 2022. [Youtube recording]
- Hadley Wickham (2020). Mastering Shiny. https://mastering-shiny.org/
- Colin Fay, Sébastien Rochette, Vincent Guyader and Cervan Girard (2022). Engineering Production-Grade Shiny Apps. https://engineering-shiny.org/
- Colin Gillespie (2019). R and Security Talk at useR 2019. [Youtube recording]
License information
- Creators (initial authors): Daniel Sabanes Bove , Joe Zhu
- This work is licensed under the Creative Commons Attribution-ShareAlike 4.0 International License.
- The source files are hosted at github.com/openpharma/workshop-r-swe-md, which is forked from the original version at github.com/openpharma/workshop-r-swe.
- Important: To use this work you must provide the name of the creators (initial authors), a link to the material, a link to the license, and indicate if changes were made