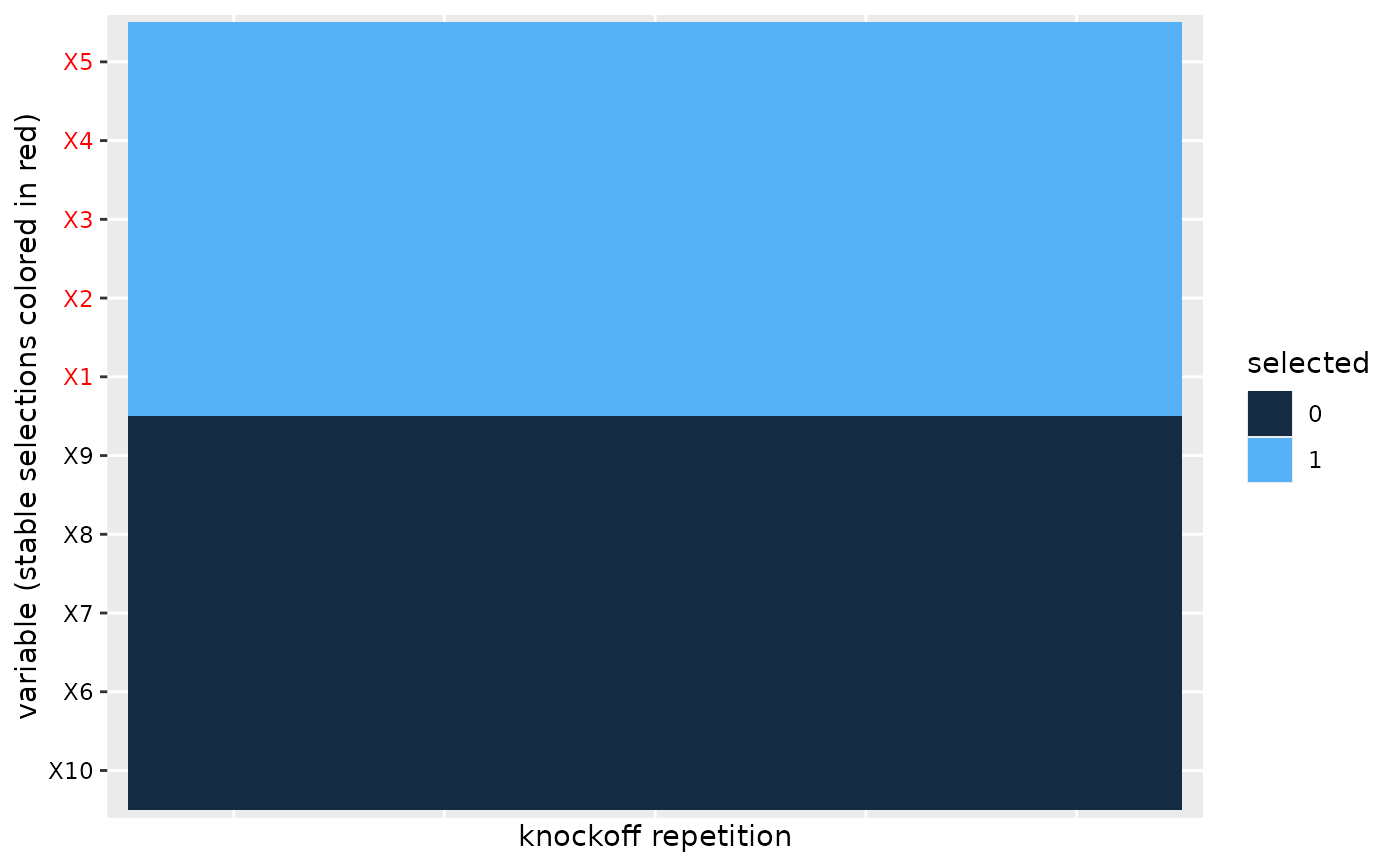
Heatmap of multiple variable selections ordered by importance
plot.variable.selections.RdHeatmap of multiple variable selections ordered by importance
Arguments
- x
data.frame of variable selections from multiple knockoffs (each entry is either 1 if variable is selected and 0 otherwise). Columns correspond to different knockoffs and rows correspond to the underlying variables. row.names(x) records the variable names.
- ...
Additional arguments passed to other plot methods (currently ignored).
- nbcocluster
bivariate vector c(number of variable clusters, number of selection clusters). The former number must be specified less than nrow(x) and the latter must be less than ncol(x).
Details
To help visualize most important variables we perform clustering both selections and variables.
Examples
library(knockofftools)
set.seed(1)

# Simulate 8 Gaussian covariate predictors and 2 binary factors:
X <- generate_X(n=100, p=10, p_b=2, cov_type="cov_equi", rho=0.2)

# create linear predictor with first 5 beta-coefficients = 1 (all other zero)
lp <- generate_lp(X, p_nn = 5, a=1)

# Simulate response:
y <- lp + rnorm(100)

# Calculate knockoff statistics:
W <- knockoff.statistics(y=y, X=X, type="regression", M=5)
#> Running sequentially ('LOCAL') ...

S <- variable.selections(W, error.type = "pfer", level = 1)

# plot heatmap of knockoff selections:
plot(S)
#> Warning: Vectorized input to `element_text()` is not officially supported.
#> ℹ Results may be unexpected or may change in future versions of ggplot2.