We run a simulation study to verify the models in pmrm
are implemented correctly. For each simulation scenario (model type and
disease progression trajectory), we:
- Simulate 1000 datasets from the model using independent
non-
RTMBR code. - Fit the model to each simulated dataset using the
RTMB-powered implementation.
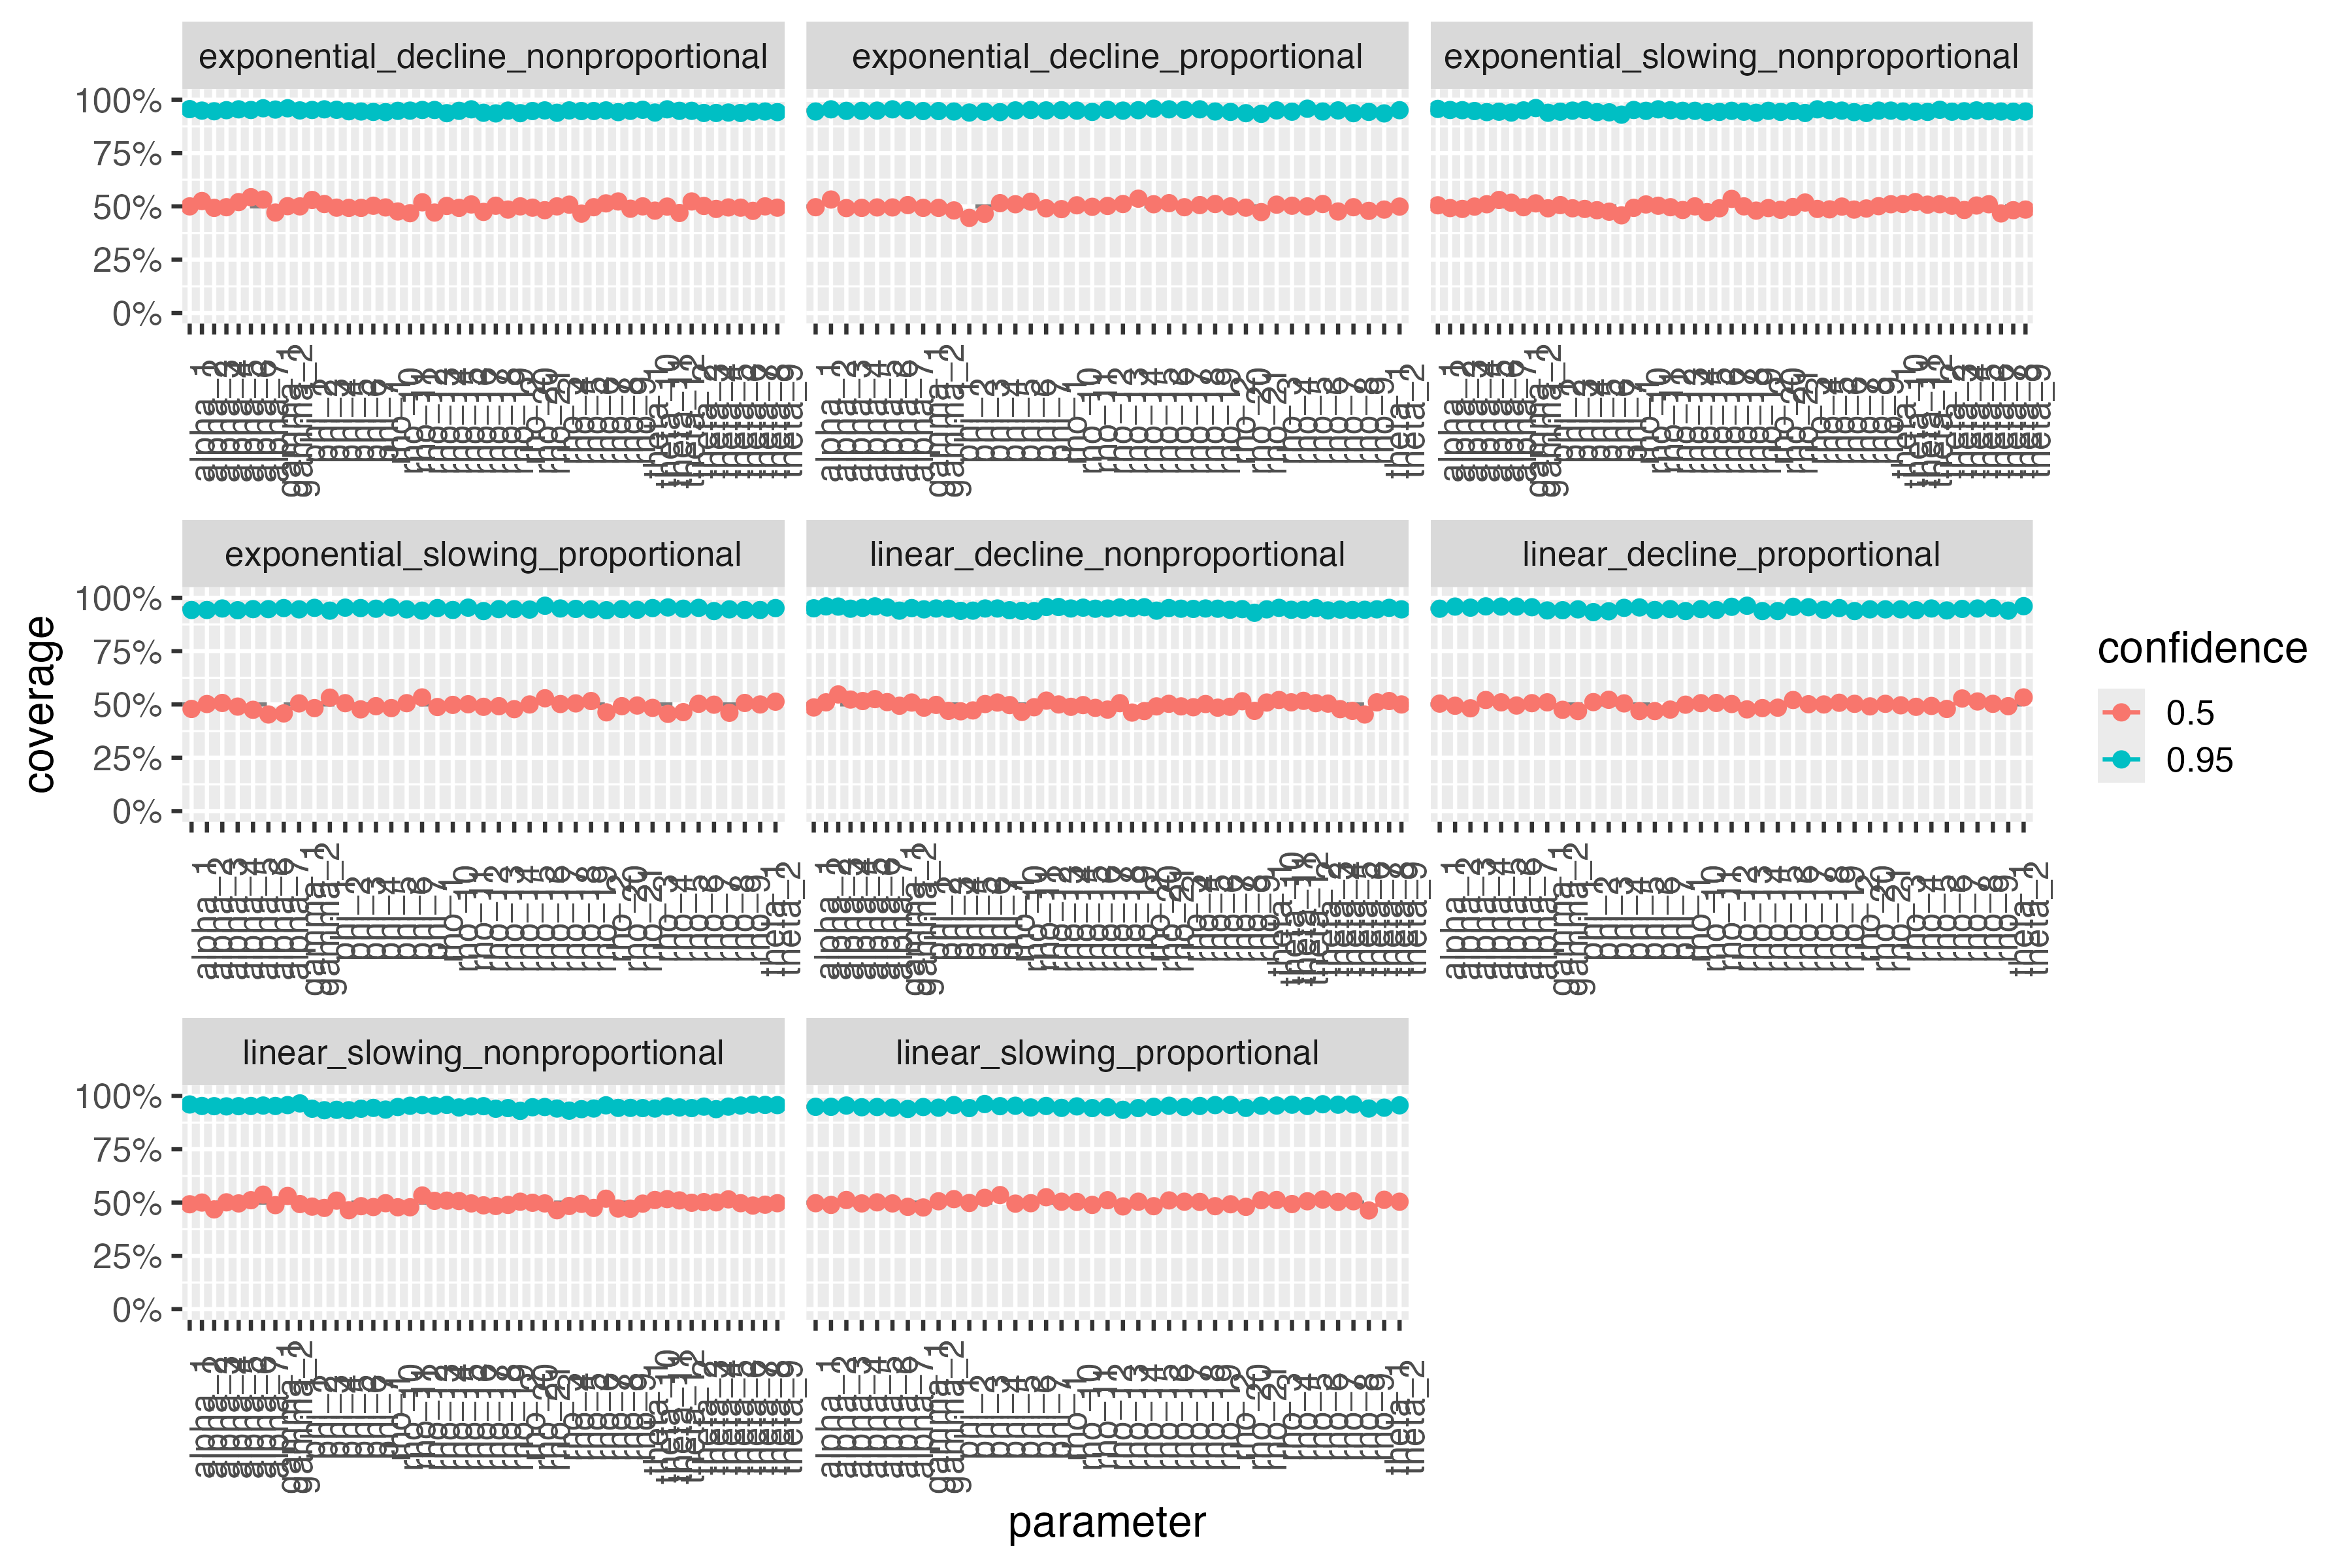
Around half of the 50% confidence intervals from (2) should cover the true data-generating parameter values in (1). Likewise, around 95% of the 95% confidence intervals from (2) should cover the truth. In addition, we expect all models to converge.
Implementation
This simulation study is a targets pipeline in the
vignettes/validation/ directory of the source code of
pmrm. To run the pipeline, change to that working directory
and call targets::tar_make(). Due to the computational
cost, we only run this pipeline once per release.
Convergence
The following table shows the percentage of fitted models that converged for each scenario.
read_csv(file.path("validation", "convergence.csv")) |>
  mutate(convergence = label_percent()(convergence)) |>
kable()| scenario | convergence |
|---|---|
| exponential_decline_nonproportional | 100% |
| exponential_decline_proportional | 100% |
| exponential_slowing_nonproportional | 100% |
| exponential_slowing_proportional | 100% |
| linear_decline_nonproportional | 100% |
| linear_decline_proportional | 100% |
| linear_slowing_nonproportional | 100% |
| linear_slowing_proportional | 100% |
Parameter coverage
The following plot shows the percentage of confidence intervals that covered the true parameter values. Coverage is shown separately for each parameter in each scenario. For reference, the expected coverage rate is shown as a horizontal solid in each facet.
include_graphics(file.path("validation", "coverage.png"))