Method to add pointwise confidence intervals to a an object
created by visR through an S3 method. The method is set up to use
the pipe %>%. There are two options to display CI's, a "ribbon" or
as "step" lines.
No default method is available at the moment.
Usage
add_CI(gg, ...)

# S3 method for ggsurvfit
add_CI(gg, alpha = 0.1, style = "ribbon", linetype, ...)

# S3 method for ggtidycuminc
add_CI(gg, alpha = 0.1, style = "ribbon", linetype, ...)
Arguments
- gg
A ggplot created with visR
- ...
other arguments passed on to the method to modify
geom_ribbon- alpha
aesthetic of ggplot2
geom_ribbon. Default is 0.1.- style
aesthetic of ggplot2
geom_ribbon. Default is "ribbon". An alternative option is "step" that uses a line to display interval bounds.- linetype
aesthetic of ggplot2
geom_ribbon.
Examples
library(visR)
# Estimate KM curves by treatment group
survfit_object <- survival::survfit(data = adtte, survival::Surv(AVAL, 1 - CNSR) ~ TRTP)
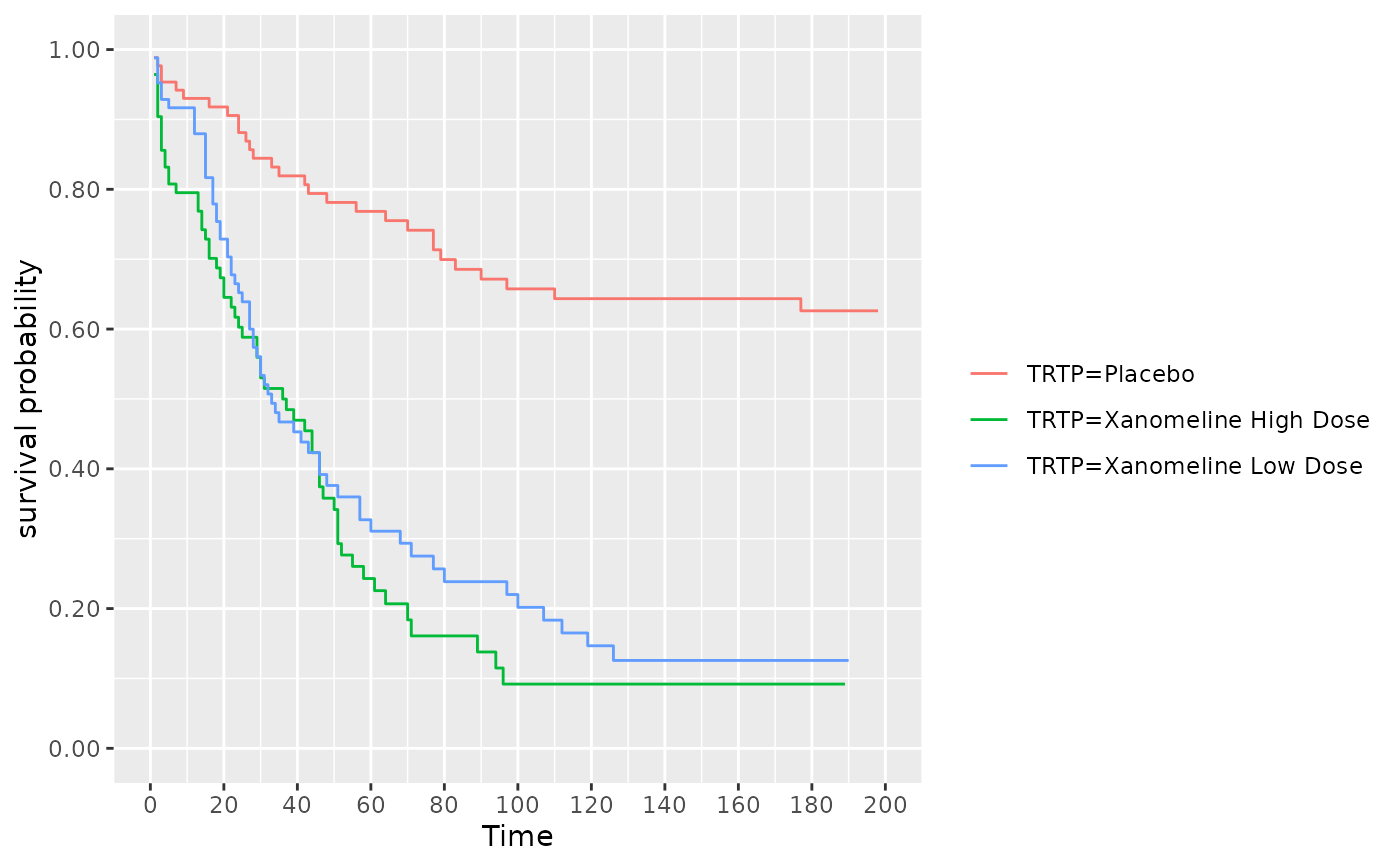
## plot without confidence intervals (CI)
p <- visR::visr(survfit_object)
#> Warning: `visr.survfit()` was deprecated in visR 0.4.0.
#> ℹ Please use `ggsurvfit::ggsurvfit()` instead.
p
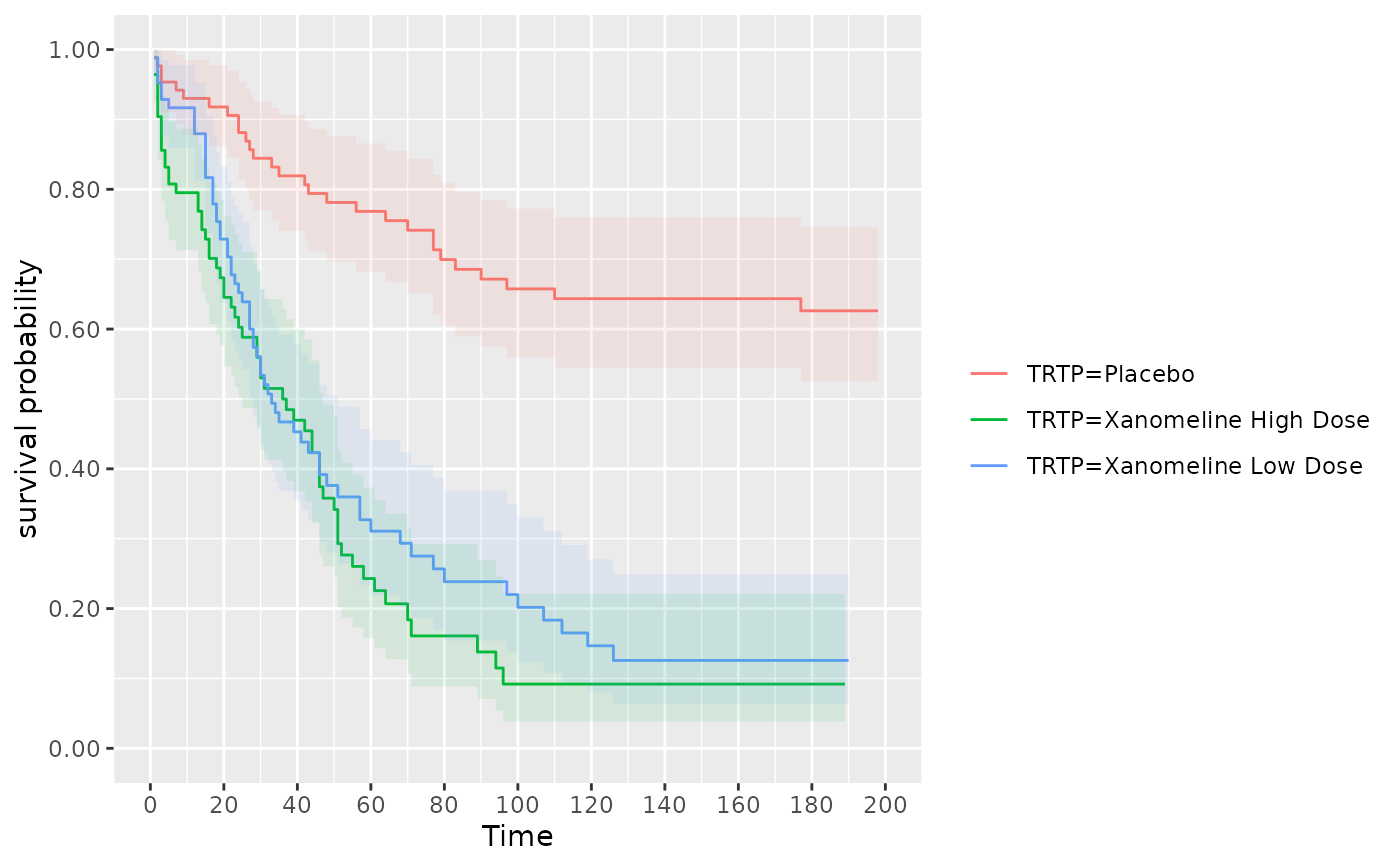
 # add CI to plot with default settings
p %>% add_CI()
# add CI to plot with default settings
p %>% add_CI()
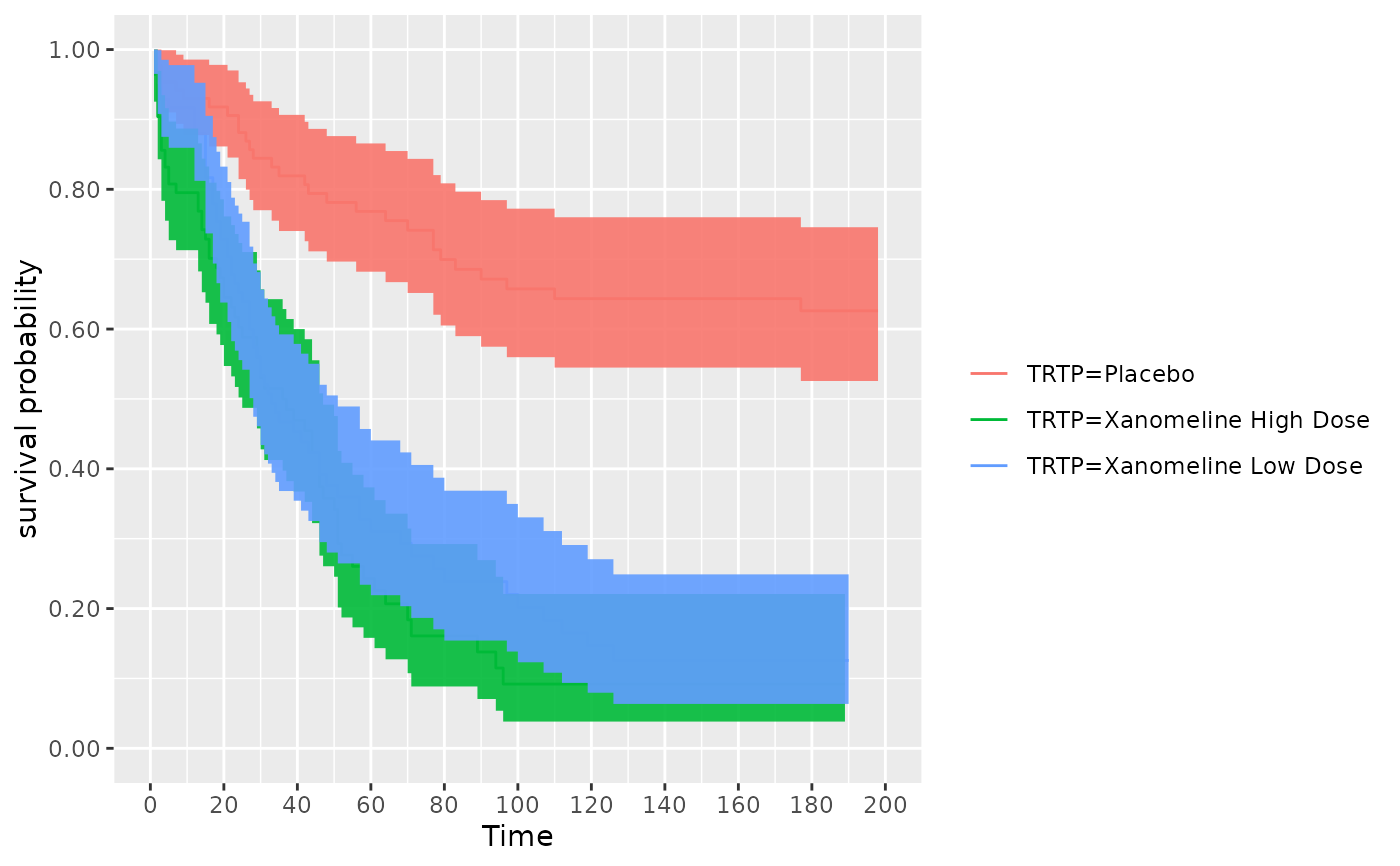
 # change transparency of CI ribbon
p %>% add_CI(alpha = 0.9, style = "ribbon")
# change transparency of CI ribbon
p %>% add_CI(alpha = 0.9, style = "ribbon")
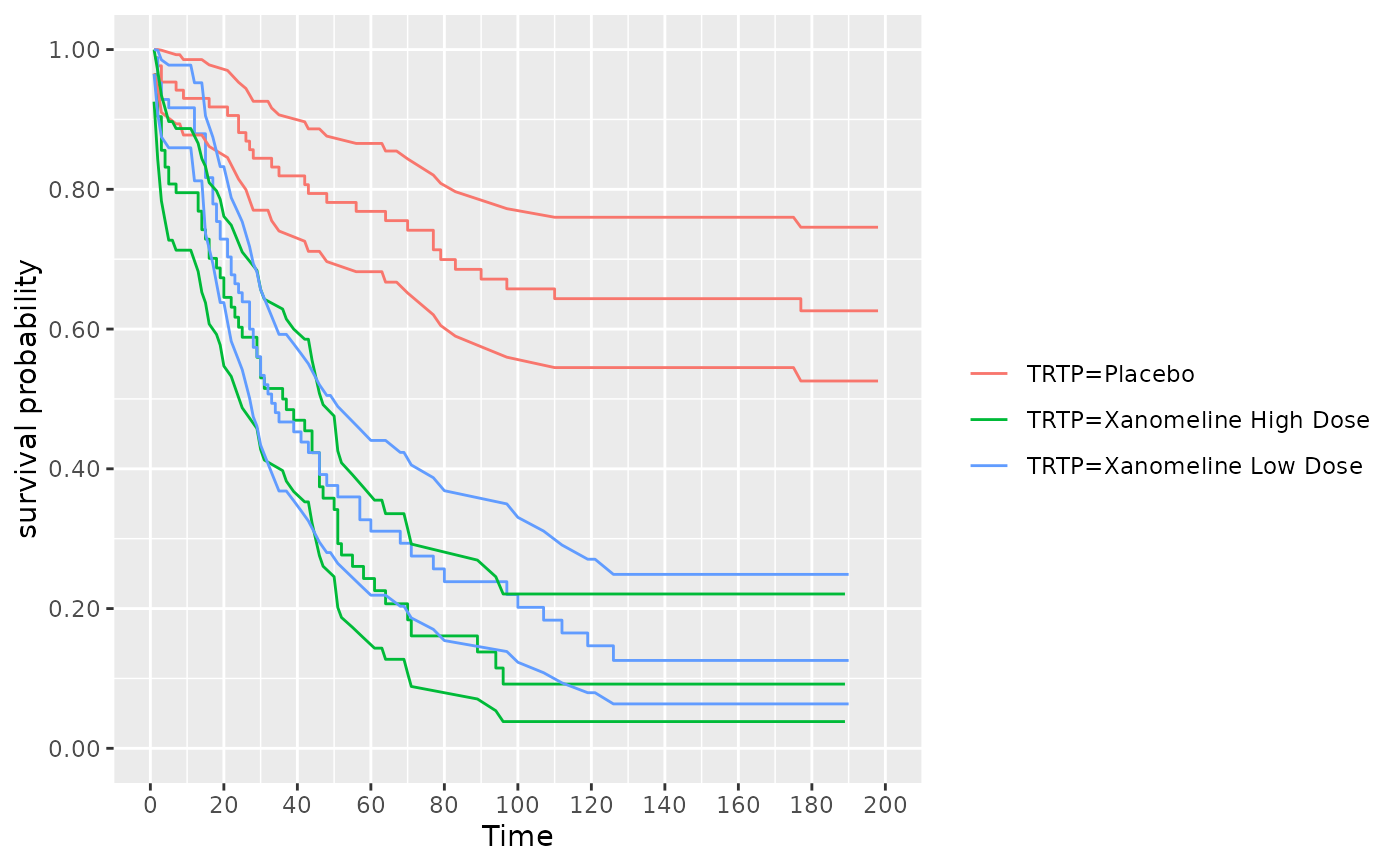
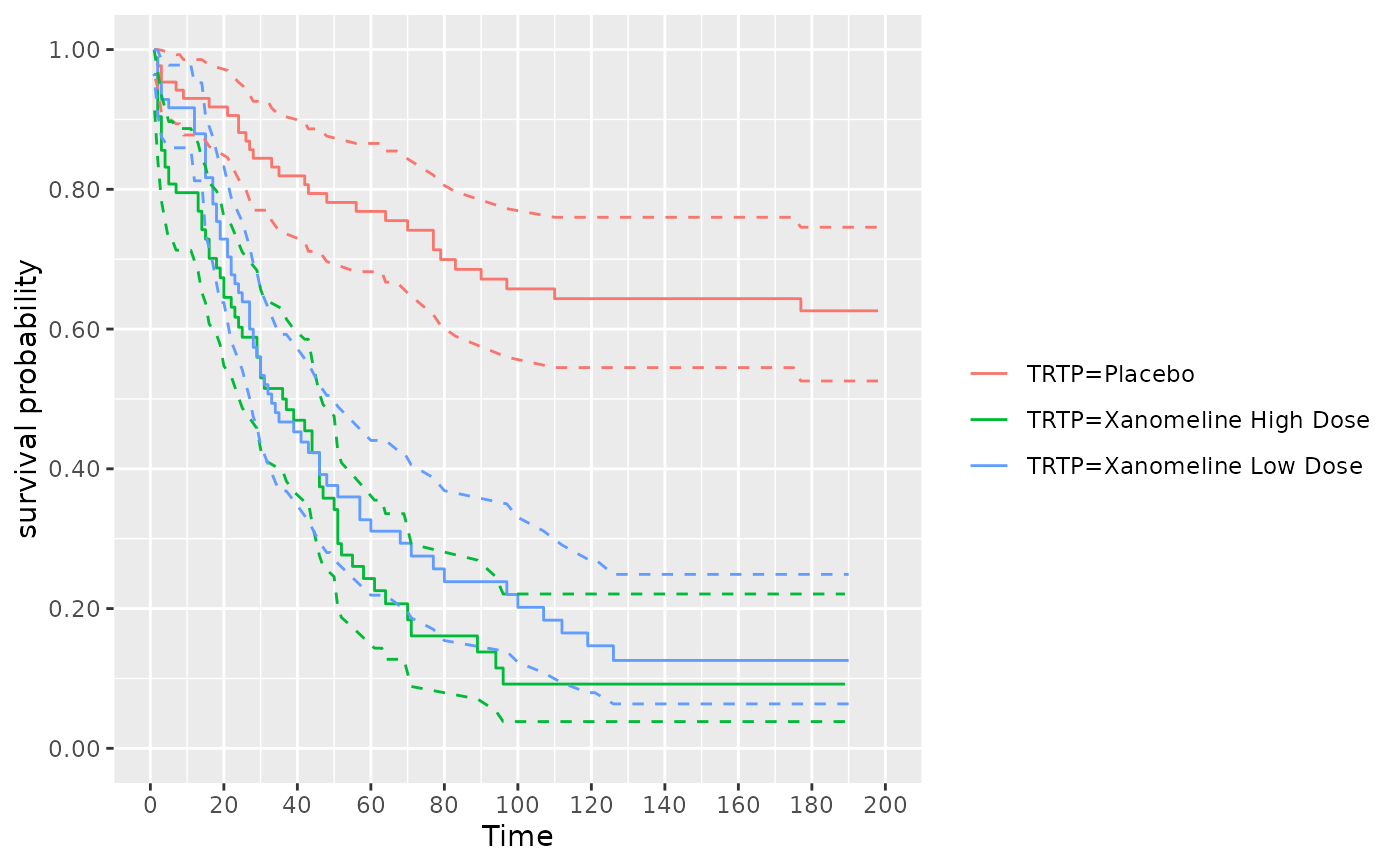
 # plot CI as a step line instead of ribbon
p %>% add_CI(alpha = 0.1, style = "step")
# plot CI as a step line instead of ribbon
p %>% add_CI(alpha = 0.1, style = "step")
 # change linetype of CI
p %>% add_CI(style = "step", linetype = 1)
# change linetype of CI
p %>% add_CI(style = "step", linetype = 1)