Wrapper around ggplot2::annotation_custom for simplified annotation to ggplot2 plots.
This function accepts a string, dataframe, data.table, tibble or customized
objects of class gtable and places them on the specified location on
the ggplot. The layout is fixed: bold column headers and plain body.
Only the font size and type can be chosen.
Both the initial plot as the individual annotation are stored as attribute component
in the final object.
Usage
add_annotation(
  gg = NULL,
  label = NULL,
  base_family = "sans",
  base_size = 11,
  xmin = -Inf,
  xmax = Inf,
  ymin = -Inf,
  ymax = Inf
)
Arguments
- gg
Object of class
ggplot.- label
String, dataframe, data.table, tibbleused to annotate theggplot.- base_family
character. Base font family- base_size
numeric. Base font size in pt- xmin
x coordinates giving horizontal location of raster in which to fit annotation.
- xmax
x coordinates giving horizontal location of raster in which to fit annotation.
- ymin
y coordinates giving vertical location of raster in which to fit annotation.
- ymax
y coordinates giving vertical location of raster in which to fit annotation.
Examples
## Estimate survival
surv_object <- visR::estimate_KM(data = adtte, strata = "TRTP")

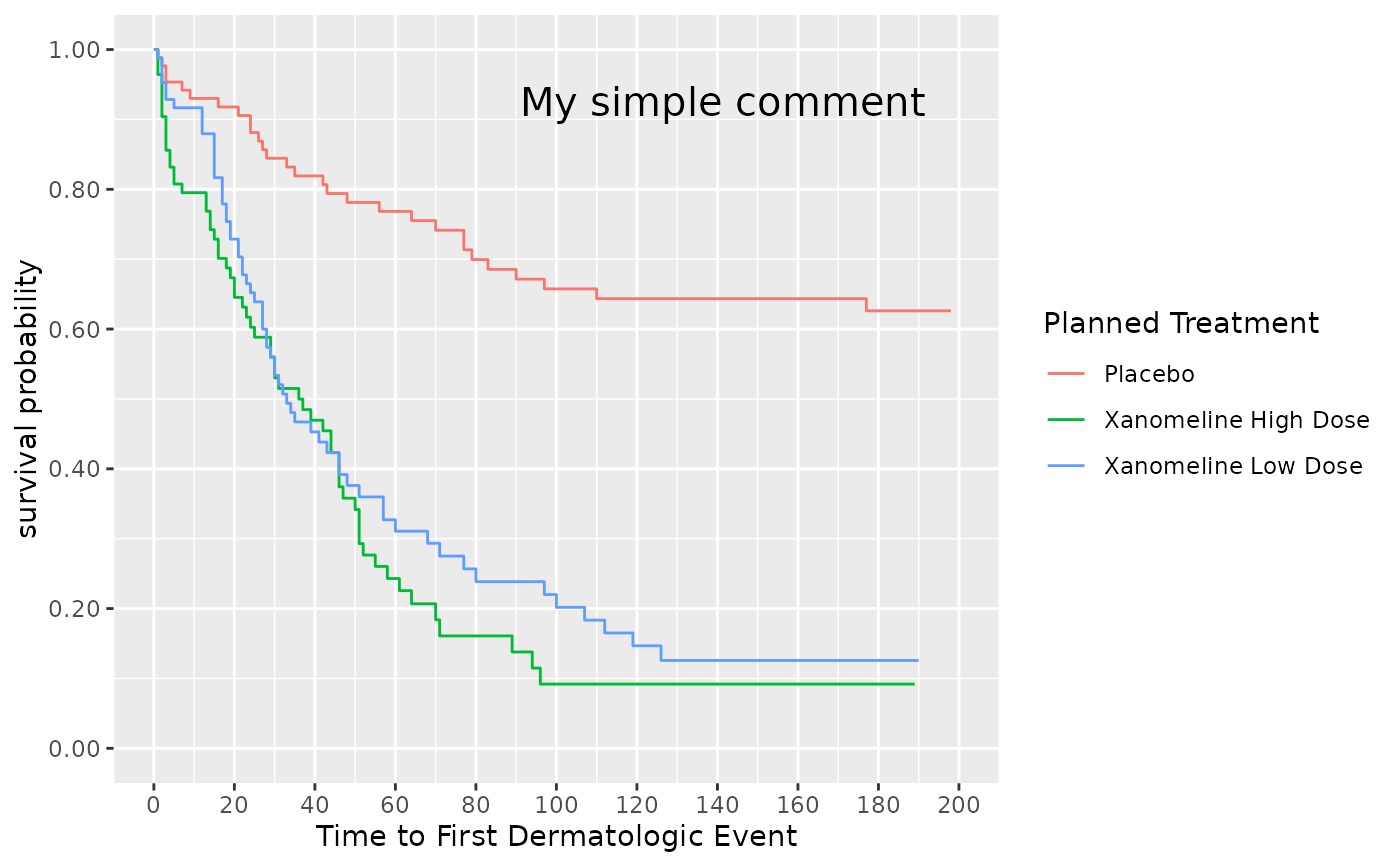
## We want to annotate the survival KM plot with a simple string comment
visR::visr(surv_object) %>%
  visR::add_annotation(
    label = "My simple comment",
    base_family = "sans",
    base_size = 15,
    xmin = 110,
    xmax = 180,
    ymin = 0.80
  )


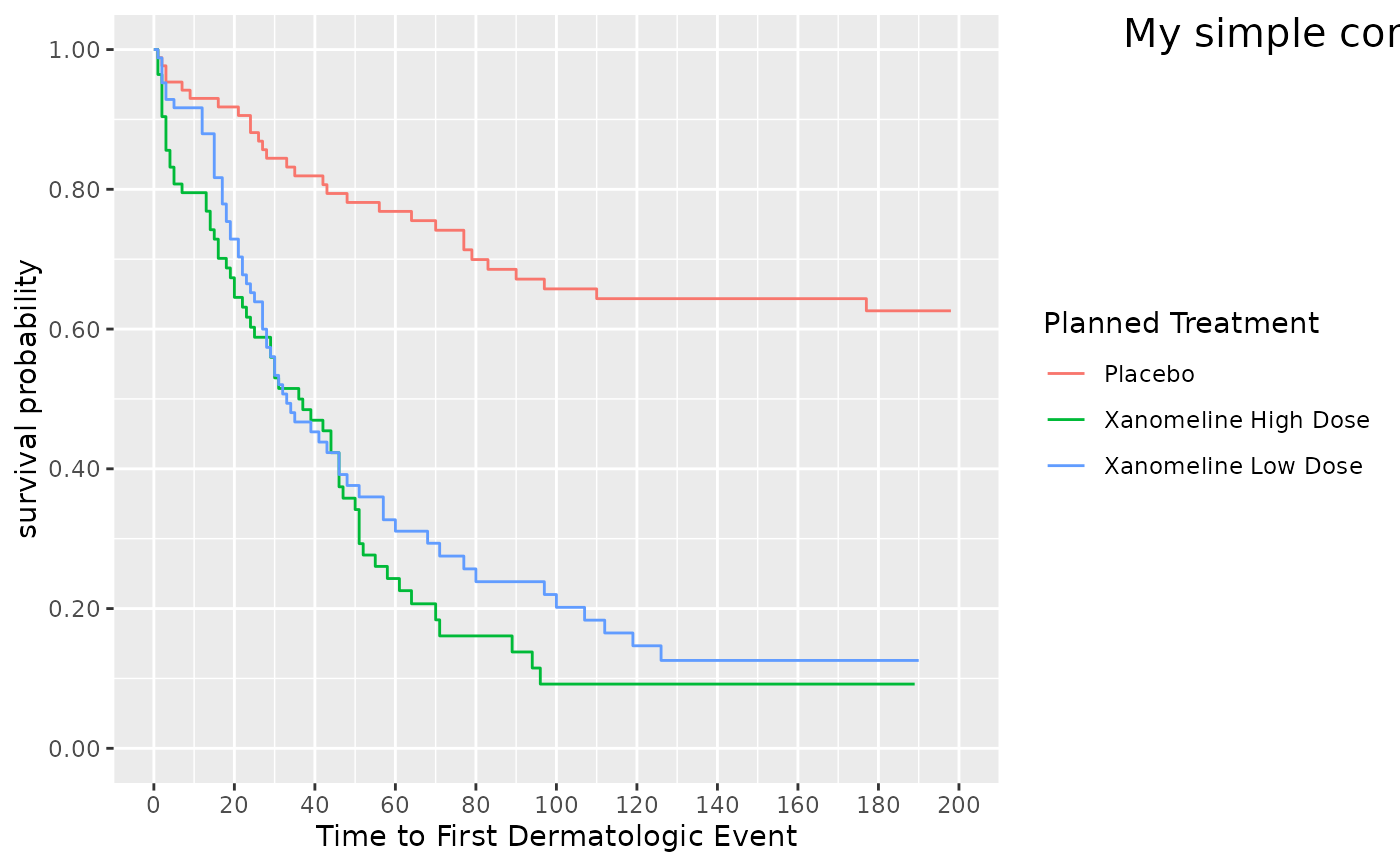
## Currently, care needs to be taken on the x-y values relative
## to the plot data area. Here we are plotting outside of the data area.
visR::visr(surv_object) %>%
  visR::add_annotation(
    label = "My simple comment",
    base_family = "sans",
    base_size = 15,
    xmin = 210,
    xmax = 380,
    ymin = 1.0
  )


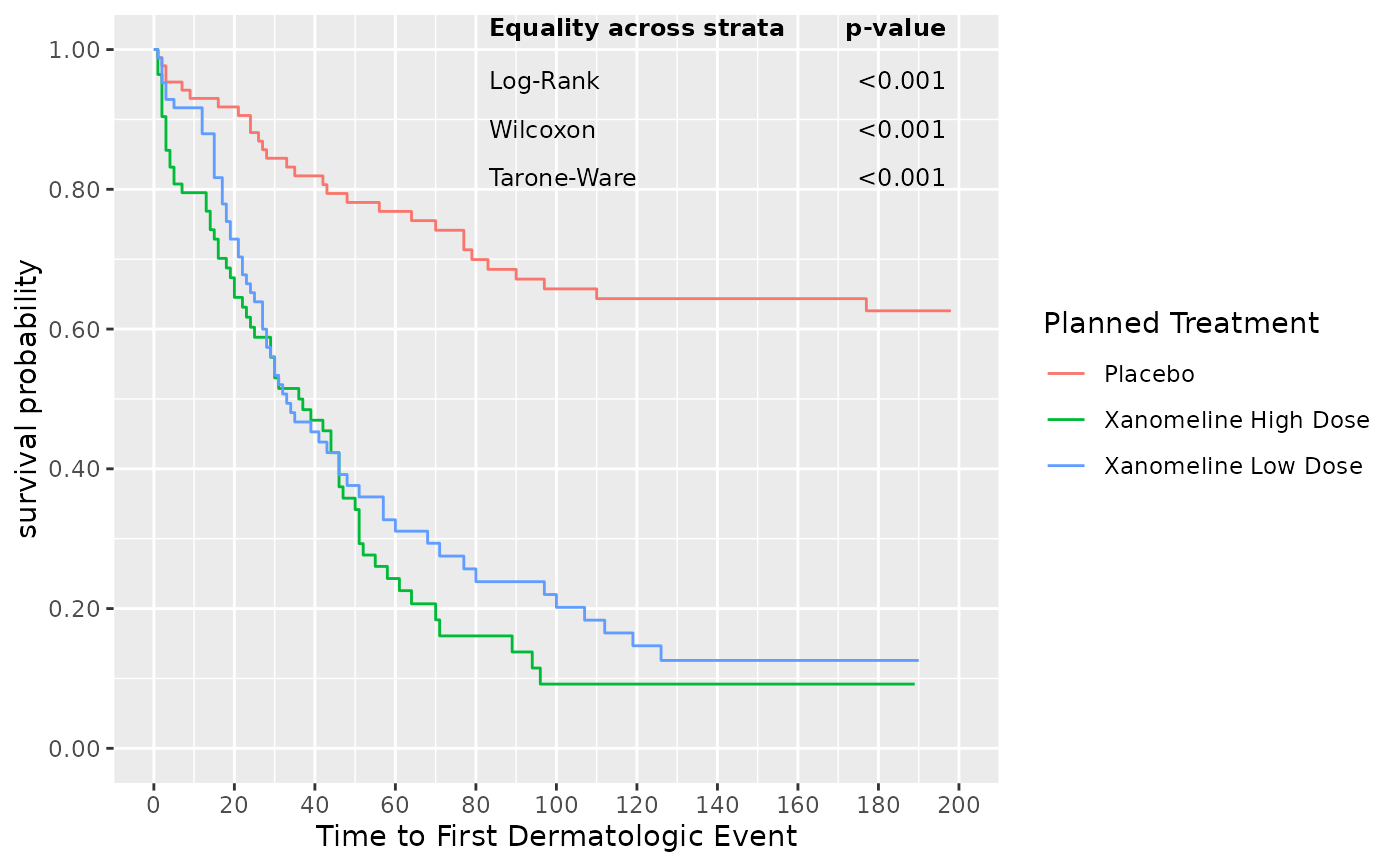
## We may also want to annotate a KM plot with information
## from additional tests or estimates. This example we annotate
## with p-values contained in a tibble

## we calculate p-values for "Equality across strata"
lbl <- visR::get_pvalue(surv_object,
  statlist = c("test", "pvalue"),
  type = "All"
)

## display p-values
lbl
#>   Equality across strata p-value
#> 1               Log-Rank  <0.001
#> 2               Wilcoxon  <0.001
#> 3            Tarone-Ware  <0.001

## Now annotate survival KM plot with the p-values
visR::visr(surv_object) %>%
  visR::add_annotation(
    label = lbl,
    base_family = "sans",
    base_size = 9,
    xmin = 100,
    xmax = 180,
    ymin = 0.80
  )

