This function aligns multiple ggplot graphs by making them the same width by taking into account the legend width.
Examples
# \donttest{
## create 2 graphs
p1 <- ggplot2::ggplot(adtte, ggplot2::aes(x = as.numeric(AGE), fill = "Age")) +
ggplot2::geom_histogram(bins = 15)
p2 <- ggplot2::ggplot(adtte, ggplot2::aes(x = as.numeric(AGE))) +
ggplot2::geom_histogram(bins = 15)
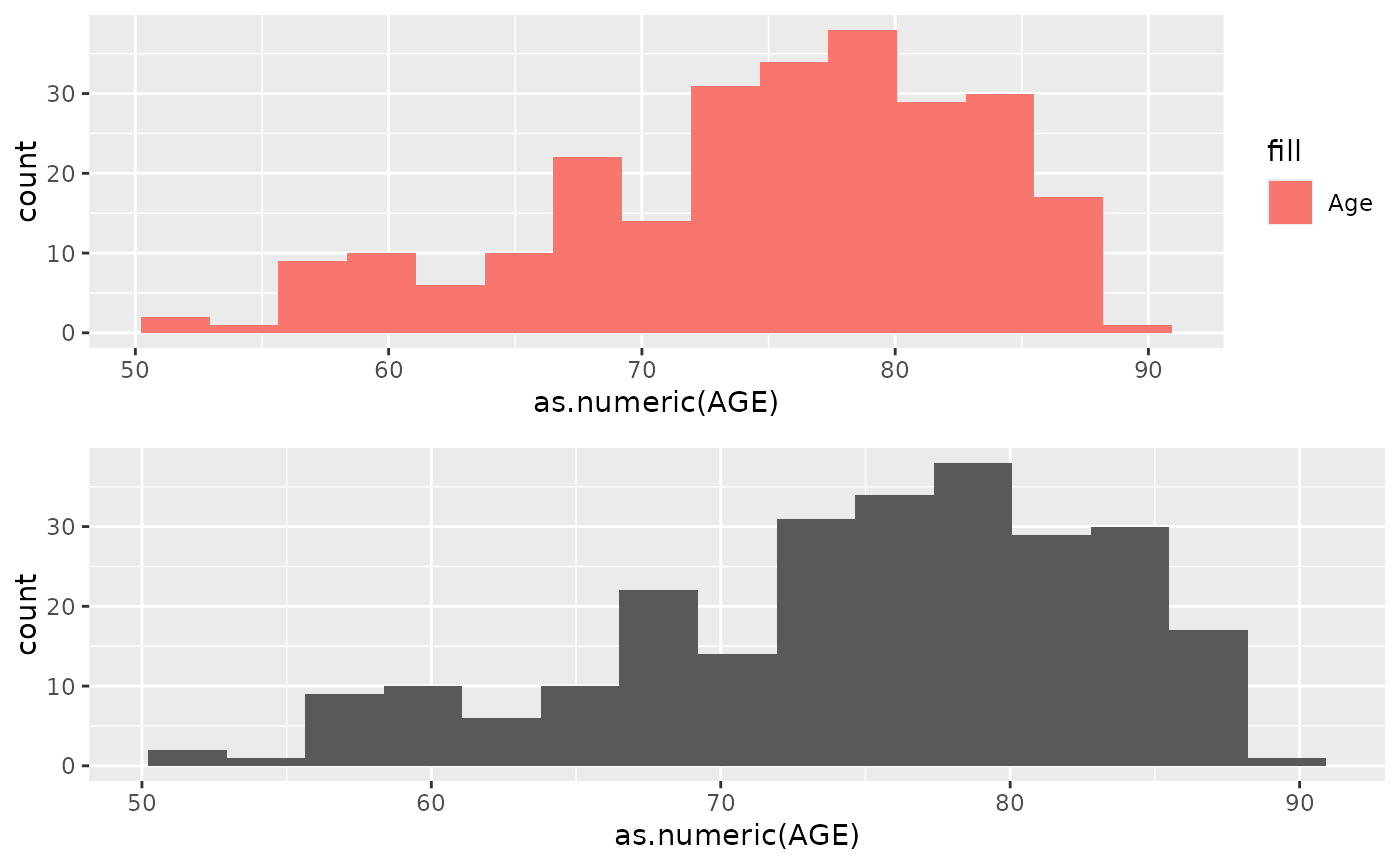
## default alignment does not take into account legend size
cowplot::plot_grid(
plotlist = list(p1, p2),
align = "none",
nrow = 2
)
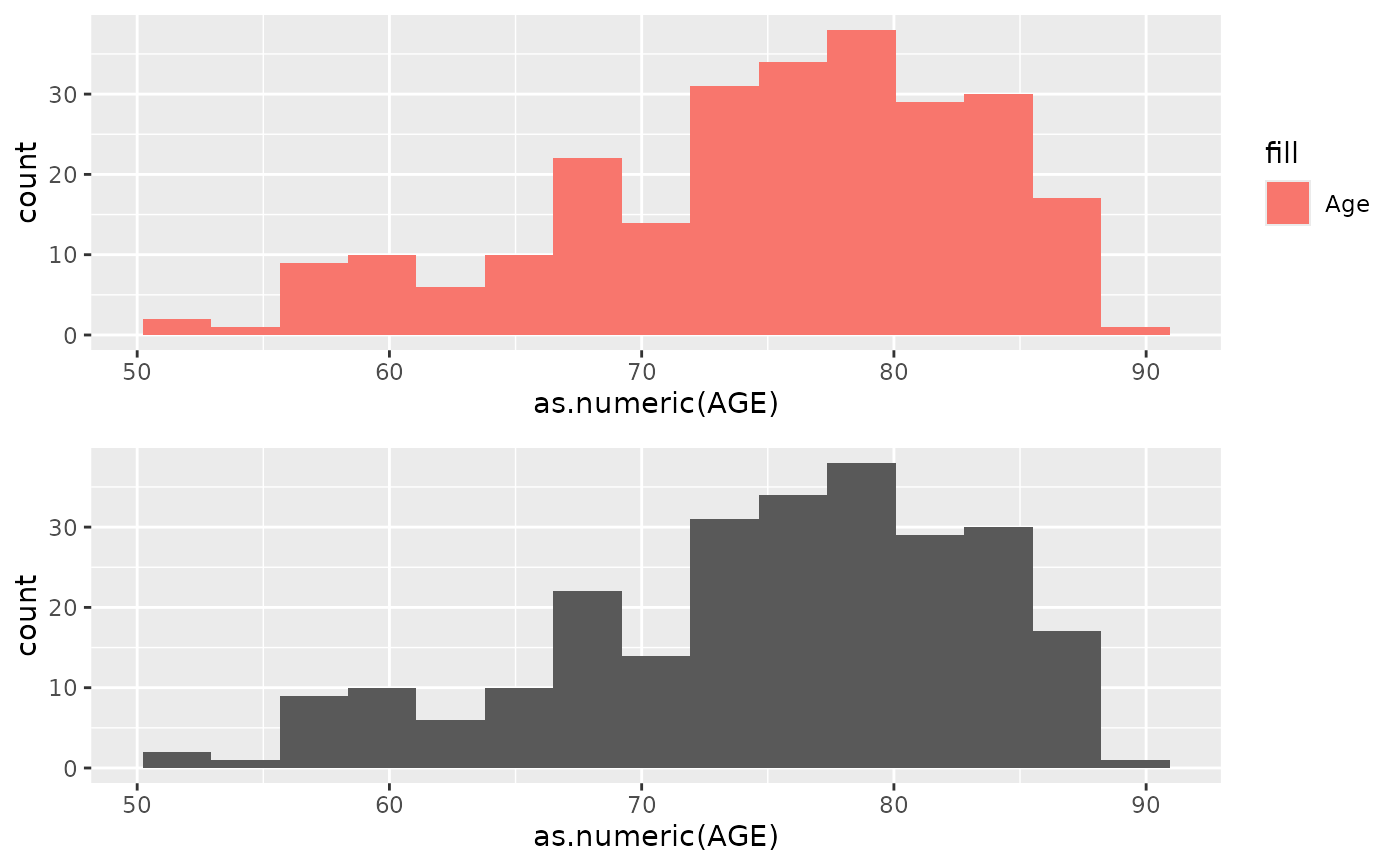
 ## align_plots() takes into account legend width
cowplot::plot_grid(
plotlist = visR::align_plots(pltlist = list(p1, p2)),
align = "none",
nrow = 2
)
## align_plots() takes into account legend width
cowplot::plot_grid(
plotlist = visR::align_plots(pltlist = list(p1, p2)),
align = "none",
nrow = 2
)
 # }
# }