![[Stable]](figures/lifecycle-stable.svg)
A method that creates a plot for DataDual object.
Usage
# S4 method for class 'DataDual,missing'
plot(x, y, blind = FALSE, ...)
Arguments
- x
(
DataDual)
object we want to plot.- y
(
missing)
missing object, for compatibility with the generic function.- blind
(
flag)
indicates whether to blind the data. IfTRUE, then placebo subjects are reported at the same level as the active dose level in the corresponding cohort, and DLTs are always assigned to the first subjects in a cohort.- ...
passed to the first inherited method
plotafter this current method.
Value
The ggplot2::ggplot2 object.
Examples
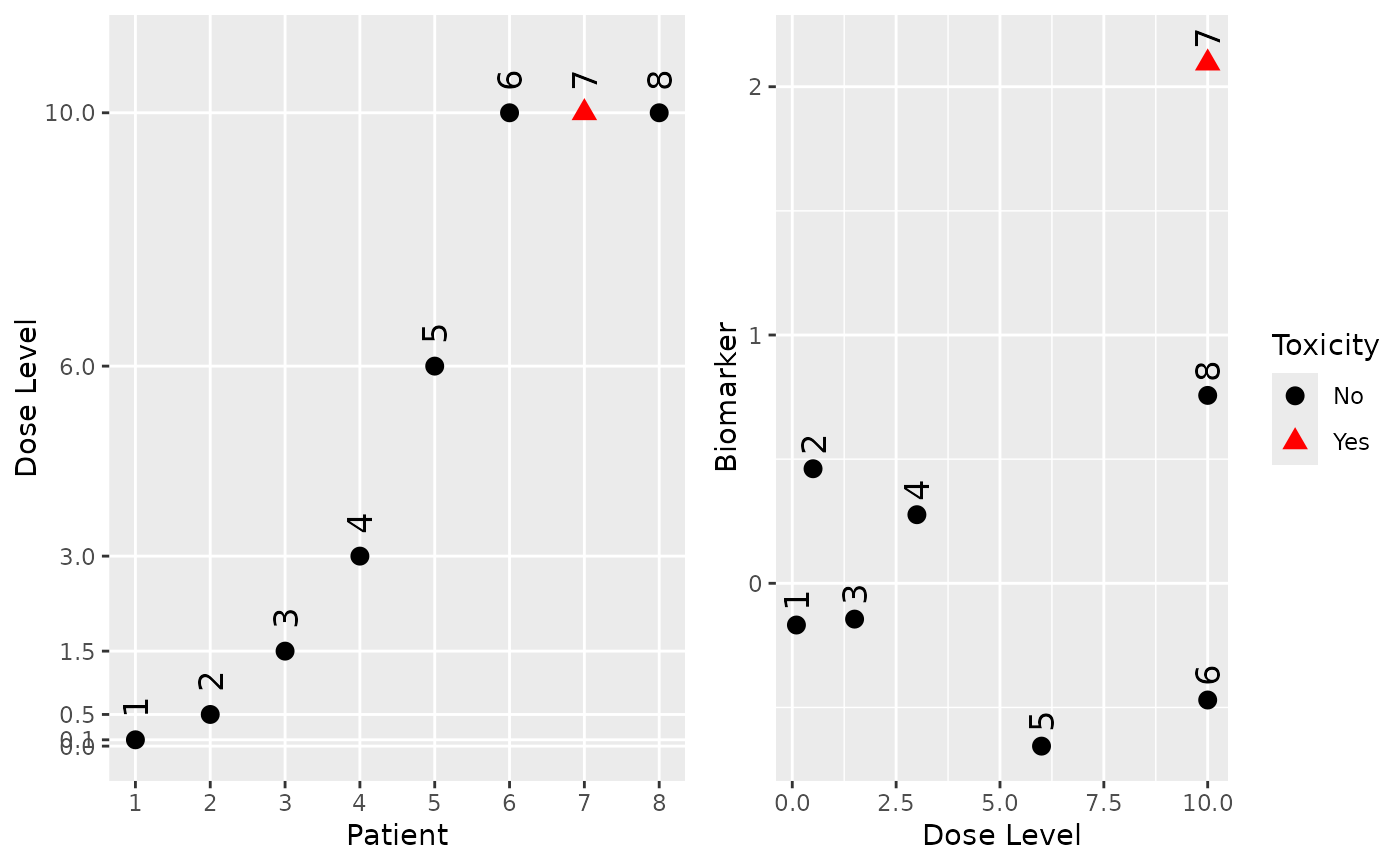
# Create some data of class 'DataDual'.
my_data <- DataDual(
  x = c(0.1, 0.5, 1.5, 3, 6, 10, 10, 10),
  y = c(0, 0, 0, 0, 0, 0, 1, 0),
  w = rnorm(8),
  doseGrid = c(0.1, 0.5, 1.5, 3, 6, seq(from = 10, to = 80, by = 2))
)
#> Used default patient IDs!
#> Used best guess cohort indices!

# Plot the data.
plot(my_data)