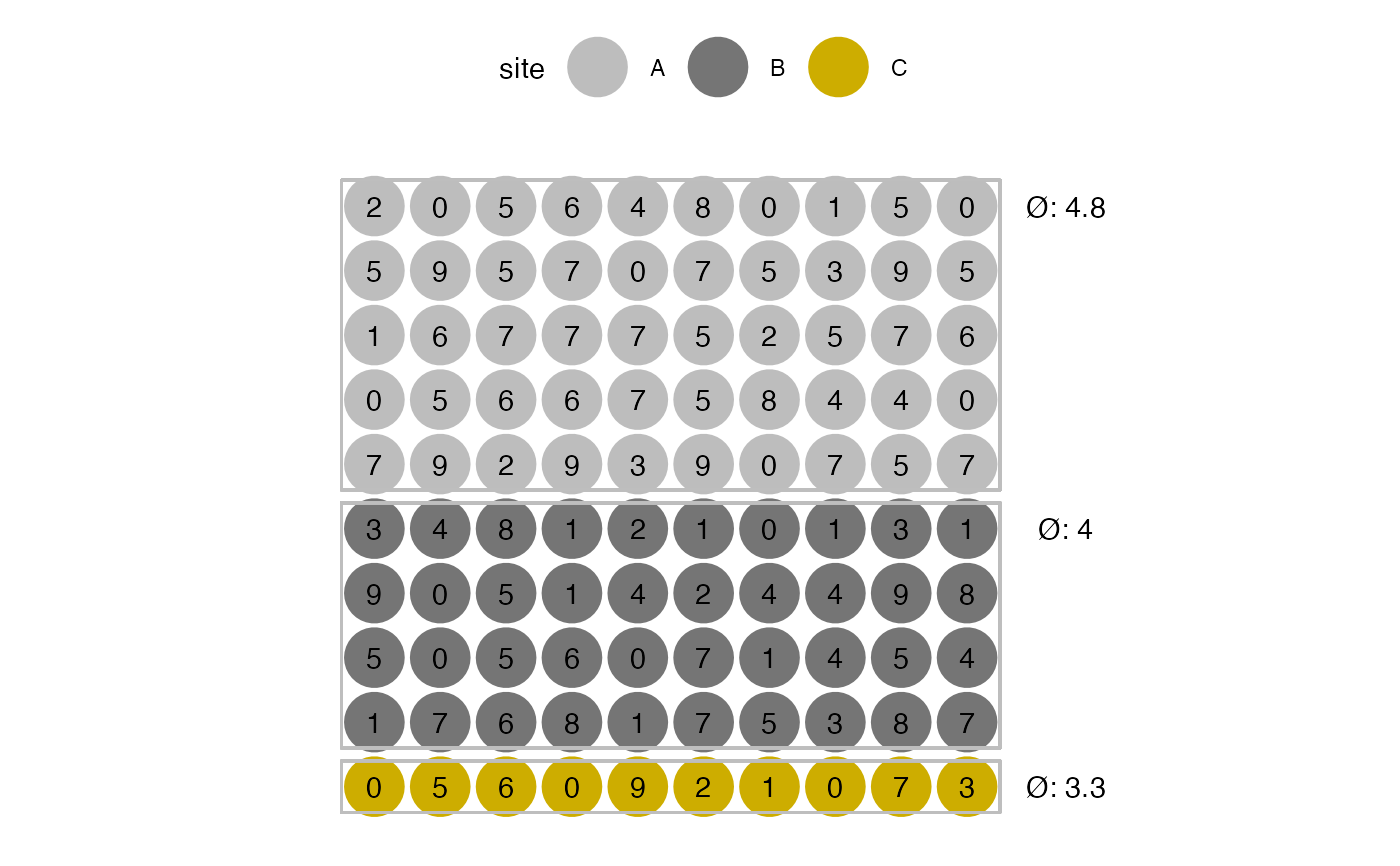
This plot is meant to supplement the package documentation.
Usage
plot_dots(
  df,
  nrow = 10,
  ncols = 10,
  col_group = "site",
  thresh = NULL,
  color_site_a = "#BDBDBD",
  color_site_b = "#757575",
  color_site_c = "gold3",
  color_high = "#00695C",
  color_low = "#25A69A",
  size_dots = 10
)
Arguments
- df
dataframe, cols = c('site', 'patients', 'n_ae')
- nrow
integer, number of rows, Default: 10
- ncols
integer, number of columns, Default: 10
- col_group
character, grouping column, Default: 'site'
- thresh
numeric, threshold to determine color of mean_ae annotation, Default: NULL
- color_site_a
character, hex color value, Default: '#BDBDBD'
- color_site_b
character, hex color value, Default: '#757575'
- color_site_c
character, hex color value, Default: 'gold3'
- color_high
character, hex color value, Default: '#00695C'
- color_low
character, hex color value, Default: '#25A69A'
- size_dots
integer, Default: 10

