Plotting dose-toxicity model fits
Usage
# S4 method for class 'Samples,GeneralModel'
plot(
  x,
  y,
  data,
  ...,
  xlab = "Dose level",
  ylab = "Probability of DLT [%]",
  showLegend = TRUE
)
Arguments
- x
the
Samplesobject- y
the
GeneralModelobject- data
the
Dataobject- ...
not used
- xlab
the x axis label
- ylab
the y axis label
- showLegend
should the legend be shown? (default)
Value
This returns the ggplot
object for the dose-toxicity model fit
Examples
# nolint start
# Create some data
data <- Data(
x = c(0.1, 0.5, 1.5, 3, 6, 10, 10, 10),
y = c(0, 0, 0, 0, 0, 0, 1, 0),
cohort = c(0, 1, 2, 3, 4, 5, 5, 5),
doseGrid = c(0.1, 0.5, 1.5, 3, 6, seq(from = 10, to = 80, by = 2))
)
#> Used default patient IDs!
# Initialize a model
model <- LogisticLogNormal(
mean = c(-0.85, 1),
cov = matrix(c(1, -0.5, -0.5, 1), nrow = 2),
ref_dose = 56
)
# Get posterior for all model parameters
options <- McmcOptions(burnin = 100, step = 2, samples = 2000)
set.seed(94)
samples <- mcmc(data, model, options)
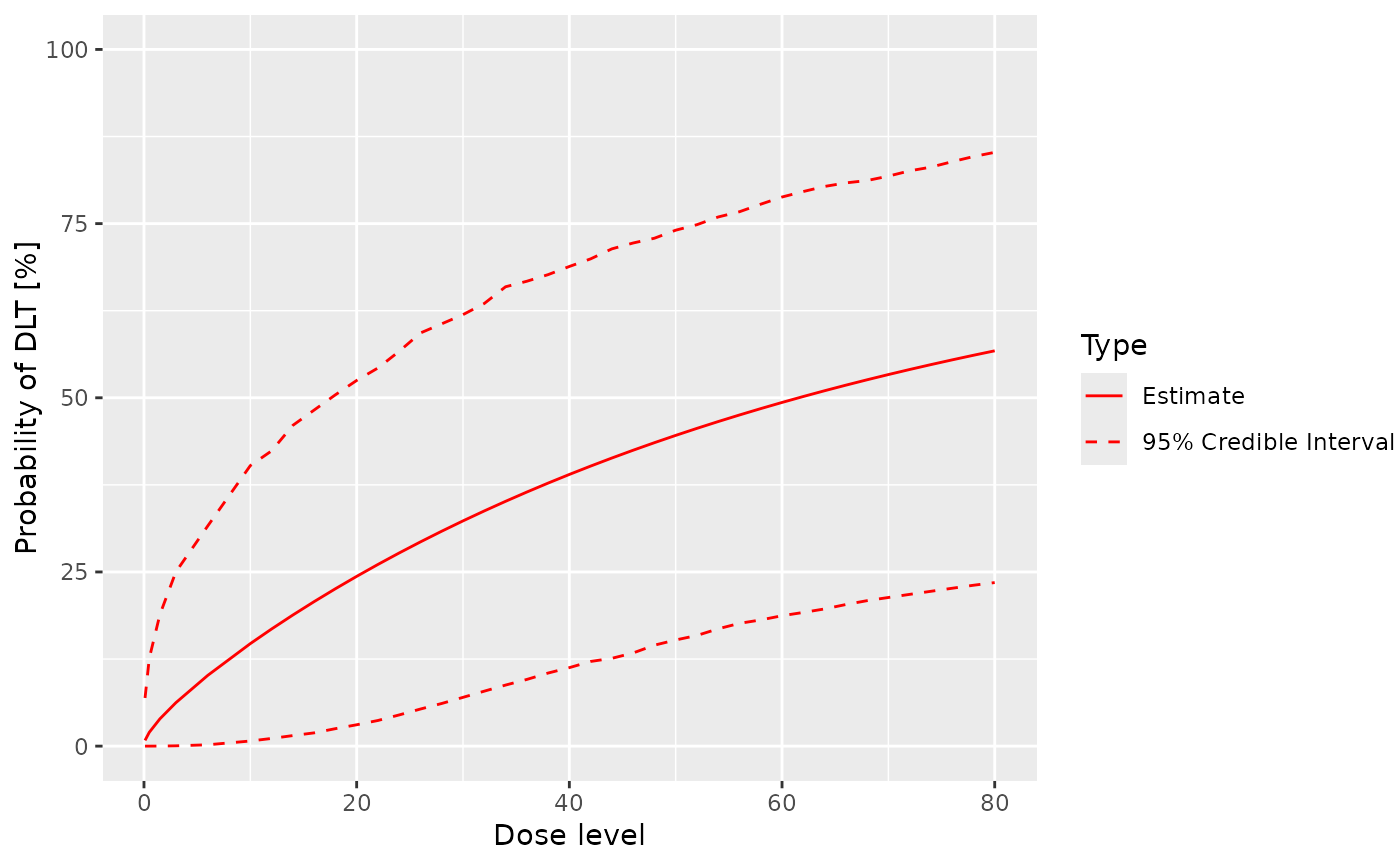
# Plot the posterior mean (and empirical 2.5 and 97.5 percentile)
# for the prob(DLT) by doses
plot(x = samples, y = model, data = data)
 # nolint end