Plot the fitted dose-efficacy curve using a model from ModelEff class with samples
Source: R/Samples-methods.R
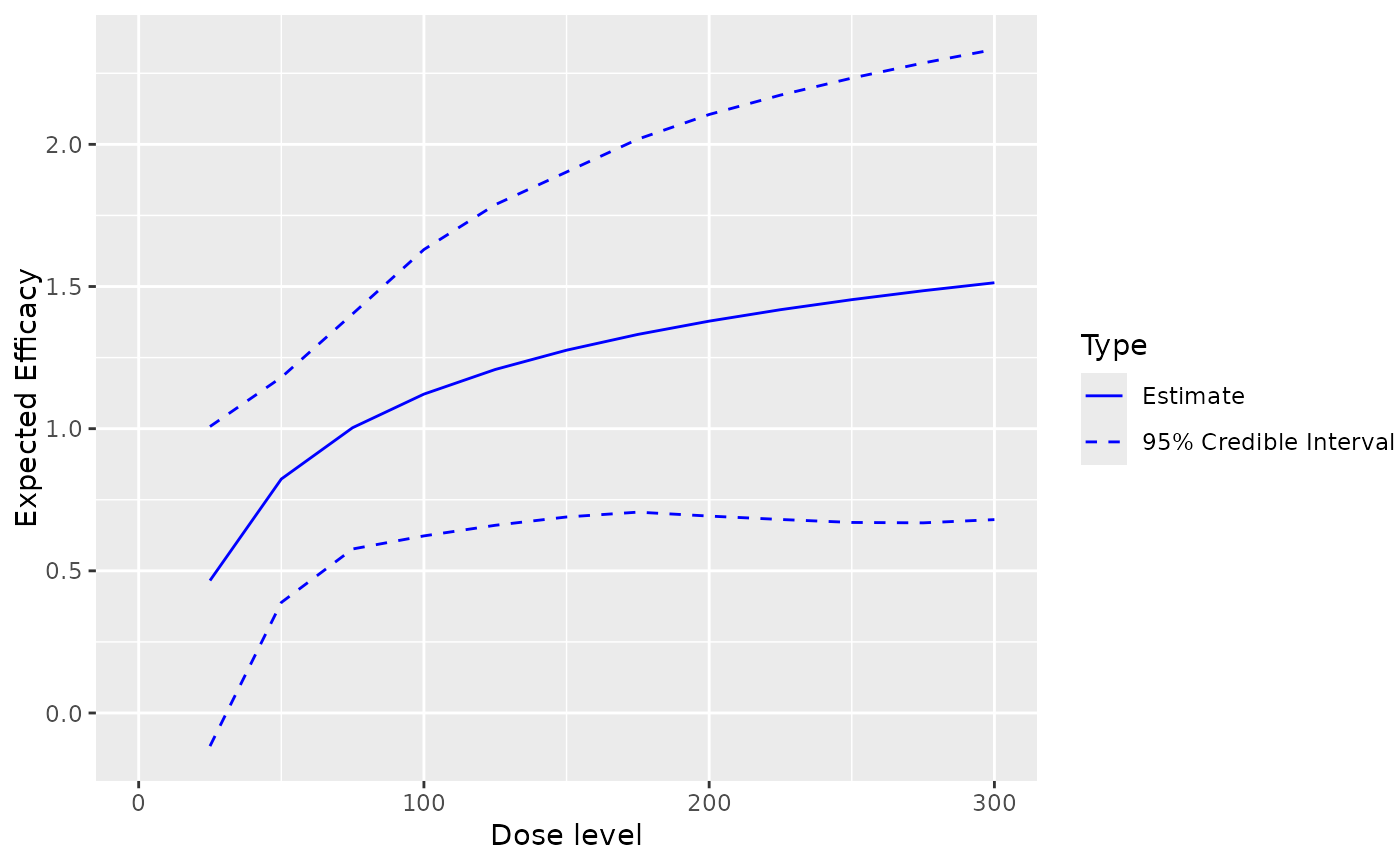
plot-Samples-ModelEff-method.RdPlot the fitted dose-efficacy curve using a model from ModelEff class
with samples
Usage
# S4 method for class 'Samples,ModelEff'
plot(
  x,
  y,
  data,
  ...,
  xlab = "Dose level",
  ylab = "Expected Efficacy",
  showLegend = TRUE
)Value
This returns the ggplot
object for the dose-efficacy model fit
Examples
# nolint start

## we need a data object with doses >= 1:
data <- DataDual(
  x = c(25, 50, 25, 50, 75, 300, 250, 150),
  y = c(0, 0, 0, 0, 0, 1, 1, 0),
  w = c(0.31, 0.42, 0.59, 0.45, 0.6, 0.7, 0.6, 0.52),
  doseGrid = seq(25, 300, 25),
  placebo = FALSE
)
#> Used default patient IDs!
#> Used best guess cohort indices!
##plot the dose-efficacy curve with samples using the model from 'ModelEff'
##class e.g. 'Effloglog' class model
##define the model (see Effloglog example)
Effmodel <- Effloglog(
  eff = c(1.223, 2.513),
  eff_dose = c(25, 300),
  nu = c(a = 1, b = 0.025),
  data = data
)
## define the samples obtained using the 'Effloglog' model (see details in 'Samples' example)
##options for MCMC
options <- McmcOptions(burnin = 100, step = 2, samples = 200)
## samples must be of 'Samples' class
samples <- mcmc(data = data, model = Effmodel, options = options)
## plot the fitted dose-efficacy curve including the 95% credibility interval of the samples
## 'x' should be of 'Samples' class and 'y' of 'ModelEff' class
plot(x = samples, y = Effmodel, data = data)

# nolint end