This plots supplements the package documentation.
Usage
plot_sim_example(
  substract_ae_per_pat = 0,
  size_dots = 10,
  size_raster_label = 12,
  color_site_a = "#BDBDBD",
  color_site_b = "#757575",
  color_site_c = "gold3",
  color_high = "#00695C",
  color_low = "#25A69A",
  title = TRUE,
  legend = TRUE,
  seed = 5
)
Arguments
- substract_ae_per_pat
integer, subtract aes from patients at site C, Default: 0
- size_dots
integer, Default: 10
- size_raster_label
integer, Default: 12
- color_site_a
character, hex color value, Default: '#BDBDBD'
- color_site_b
character, hex color value, Default: '#757575'
- color_site_c
character, hex color value, Default: 'gold3'
- color_high
character, hex color value, Default: '#00695C'
- color_low
character, hex color value, Default: '#25A69A'
- title
logical, include title, Default: T
- legend
logical, include legend, Default: T
- seed
pass seed for simulations Default: 5
Details
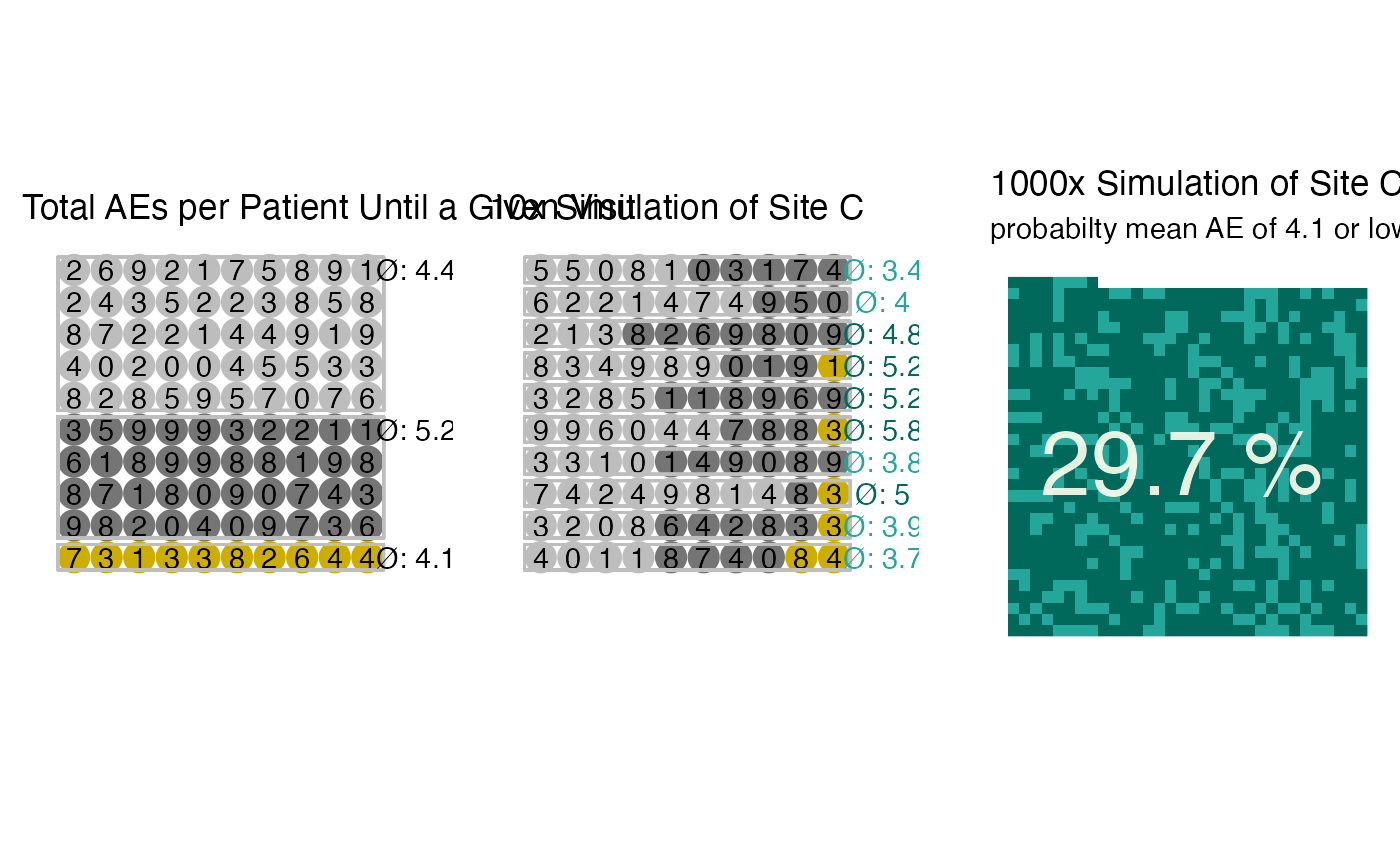
uses plot_dots() and adds 2 simulation panels, uses made-up
site config with three sites A,B,C simulating site C