Plot the gain curve in addition with the dose-DLE and dose-efficacy curve using a given DLE pseudo model, a DLE sample, a given efficacy pseudo model and an efficacy sample
Source:R/Samples-methods.R
plotGain.RdPlot the gain curve in addition with the dose-DLE and dose-efficacy curve using a given DLE pseudo model, a DLE sample, a given efficacy pseudo model and an efficacy sample
Plot the gain curve in addition with the dose-DLE and dose-efficacy curve using a given DLE pseudo model, and a given efficacy pseudo model
Usage
plotGain(DLEmodel, DLEsamples, Effmodel, Effsamples, data, ...)

# S4 method for class 'ModelTox,Samples,ModelEff,Samples'
plotGain(DLEmodel, DLEsamples, Effmodel, Effsamples, data, ...)

# S4 method for class 'ModelTox,missing,ModelEff,missing'
plotGain(DLEmodel, Effmodel, data, size = c(8L, 8L), shape = c(16L, 17L), ...)
Arguments
- DLEmodel
the dose-DLE model of
ModelToxclass object- DLEsamples
the DLE sample of
Samplesclass object- Effmodel
the dose-efficacy model of
ModelEffclass object- Effsamples
the efficacy sample of of
Samplesclass object- data
the data input of
DataDualclass object- ...
not used
- size
(
integer)
a vector of length two defining the sizes of the shapes used to identify the doses with, respectively, p(DLE = 0.3) and the maximum gain- shape
(
integer)
a vector of length two defining the shapes used to identify the doses with, respectively, p(DLE = 0.3) and the maximum gain
Value
This returns the ggplot
object for the plot
Functions
plotGain(
  DLEmodel = ModelTox,
  DLEsamples = Samples,
  Effmodel = ModelEff,
  Effsamples = Samples
)
: Standard methodplotGain( DLEmodel = ModelTox, DLEsamples = missing, Effmodel = ModelEff, Effsamples = missing ): Standard method
Examples
# nolint start
## we need a data object with doses >= 1:
data <- DataDual(
x = c(25, 50, 25, 50, 75, 300, 250, 150),
y = c(0, 0, 0, 0, 0, 1, 1, 0),
w = c(0.31, 0.42, 0.59, 0.45, 0.6, 0.7, 0.6, 0.52),
doseGrid = seq(25, 300, 25),
placebo = FALSE
)
#> Used default patient IDs!
#> Used best guess cohort indices!
##plot the dose-DLE , dose-efficacy and gain curve in the same plot with DLE and efficacy samples
##define the DLE model which must be of 'ModelTox' class
##(e.g 'LogisticIndepBeta' class model)
DLEmodel <- LogisticIndepBeta(
binDLE = c(1.05, 1.8),
DLEweights = c(3, 3),
DLEdose = c(25, 300),
data = data
)
## define the efficacy model which must be of 'ModelEff' class
## (e.g 'Effloglog' class)
Effmodel <- Effloglog(
eff = c(1.223, 2.513),
eff_dose = c(25, 300),
nu = c(a = 1, b = 0.025),
data = data,
const = 0
)
##define the DLE sample of 'Samples' class
##set up the same data set in class 'Data' for MCMC sampling for DLE
data1 <- Data(x = data@x, y = data@y, doseGrid = data@doseGrid)
#> Used default patient IDs!
#> Used best guess cohort indices!
##Define the options for MCMC
options <- McmcOptions(burnin = 100, step = 2, samples = 1000)
DLEsamples <- mcmc(data = data1, model = DLEmodel, options = options)
##define the efficacy sample of 'Samples' class
Effsamples <- mcmc(data = data, model = Effmodel, options = options)
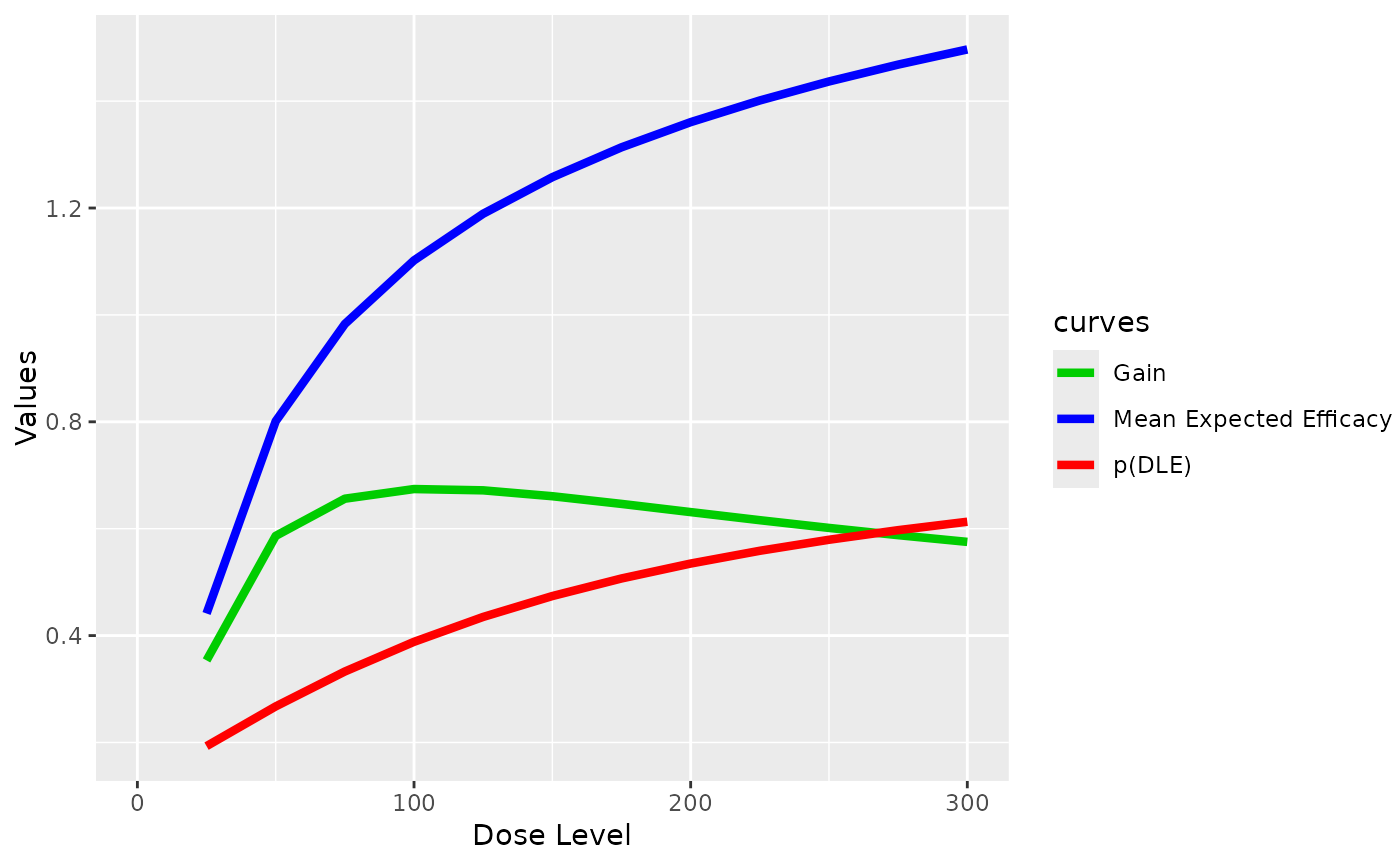
##plot the three curves of mean values of the DLEsamples, Effsamples and
##gain value samples (obtained within this plotGain function) at all dose levels
plotGain(
DLEmodel = DLEmodel,
DLEsamples = DLEsamples,
Effmodel = Effmodel,
Effsamples = Effsamples,
data = data
)
 # nolint end
# nolint start
## we need a data object with doses >= 1:
data <- DataDual(
x = c(25, 50, 25, 50, 75, 300, 250, 150),
y = c(0, 0, 0, 0, 0, 1, 1, 0),
w = c(0.31, 0.42, 0.59, 0.45, 0.6, 0.7, 0.6, 0.52),
doseGrid = seq(25, 300, 25),
placebo = FALSE
)
#> Used default patient IDs!
#> Used best guess cohort indices!
##plot the dose-DLE , dose-efficacy and gain curve in the same plot with DLE and efficacy samples
##define the DLE model which must be of 'ModelTox' class
##(e.g 'LogisticIndepBeta' class model)
DLEmodel <- LogisticIndepBeta(
binDLE = c(1.05, 1.8),
DLEweights = c(3, 3),
DLEdose = c(25, 300),
data = data
)
## define the efficacy model which must be of 'ModelEff' class
## (e.g 'Effloglog' class)
Effmodel <- Effloglog(
eff = c(1.223, 2.513),
eff_dose = c(25, 300),
nu = c(a = 1, b = 0.025),
data = data
)
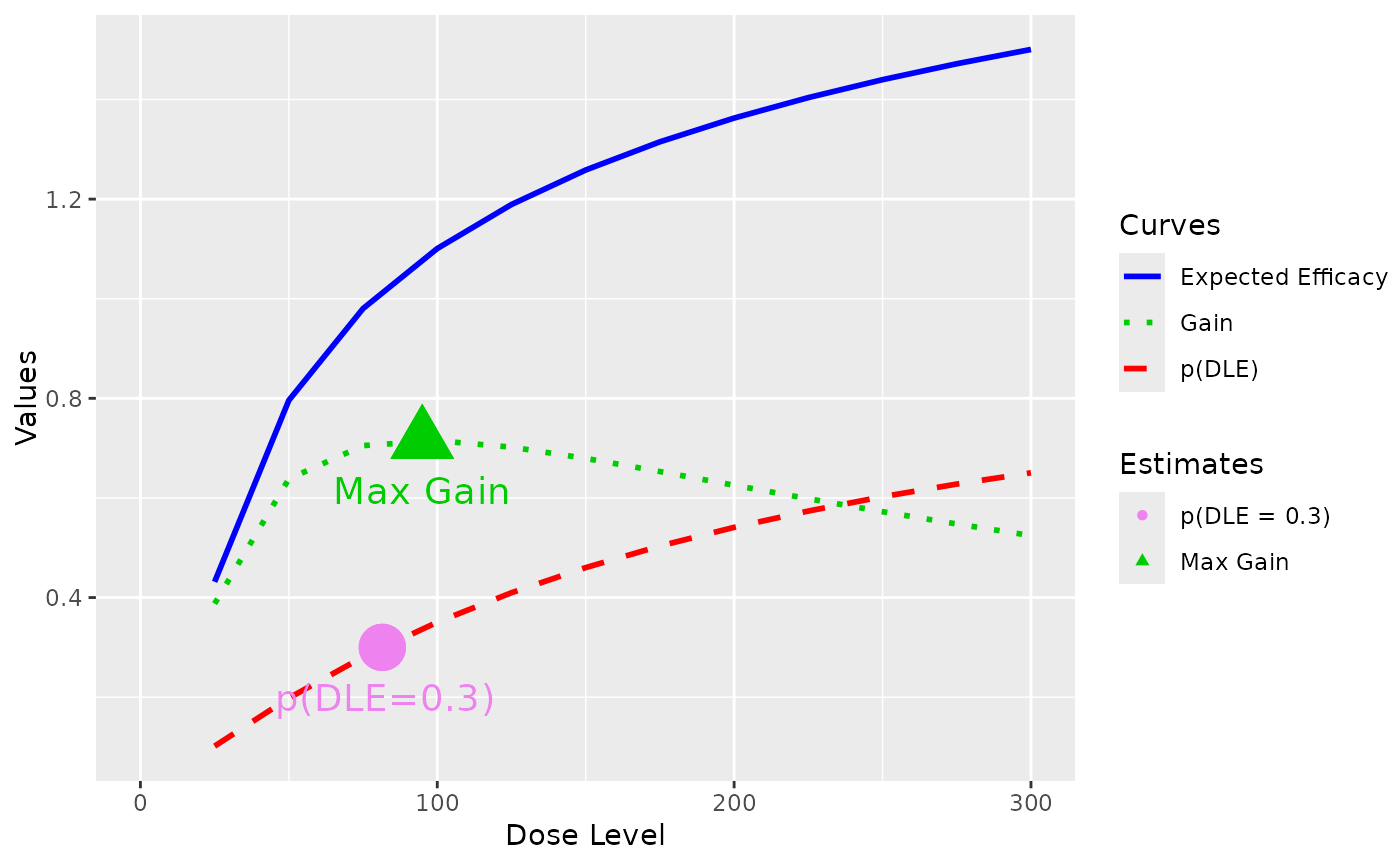
##plot the three curves of using modal estimates of model parameters at all dose levels
plotGain(DLEmodel = DLEmodel, Effmodel = Effmodel, data = data)
# nolint end
# nolint start
## we need a data object with doses >= 1:
data <- DataDual(
x = c(25, 50, 25, 50, 75, 300, 250, 150),
y = c(0, 0, 0, 0, 0, 1, 1, 0),
w = c(0.31, 0.42, 0.59, 0.45, 0.6, 0.7, 0.6, 0.52),
doseGrid = seq(25, 300, 25),
placebo = FALSE
)
#> Used default patient IDs!
#> Used best guess cohort indices!
##plot the dose-DLE , dose-efficacy and gain curve in the same plot with DLE and efficacy samples
##define the DLE model which must be of 'ModelTox' class
##(e.g 'LogisticIndepBeta' class model)
DLEmodel <- LogisticIndepBeta(
binDLE = c(1.05, 1.8),
DLEweights = c(3, 3),
DLEdose = c(25, 300),
data = data
)
## define the efficacy model which must be of 'ModelEff' class
## (e.g 'Effloglog' class)
Effmodel <- Effloglog(
eff = c(1.223, 2.513),
eff_dose = c(25, 300),
nu = c(a = 1, b = 0.025),
data = data
)
##plot the three curves of using modal estimates of model parameters at all dose levels
plotGain(DLEmodel = DLEmodel, Effmodel = Effmodel, data = data)
 # nolint end