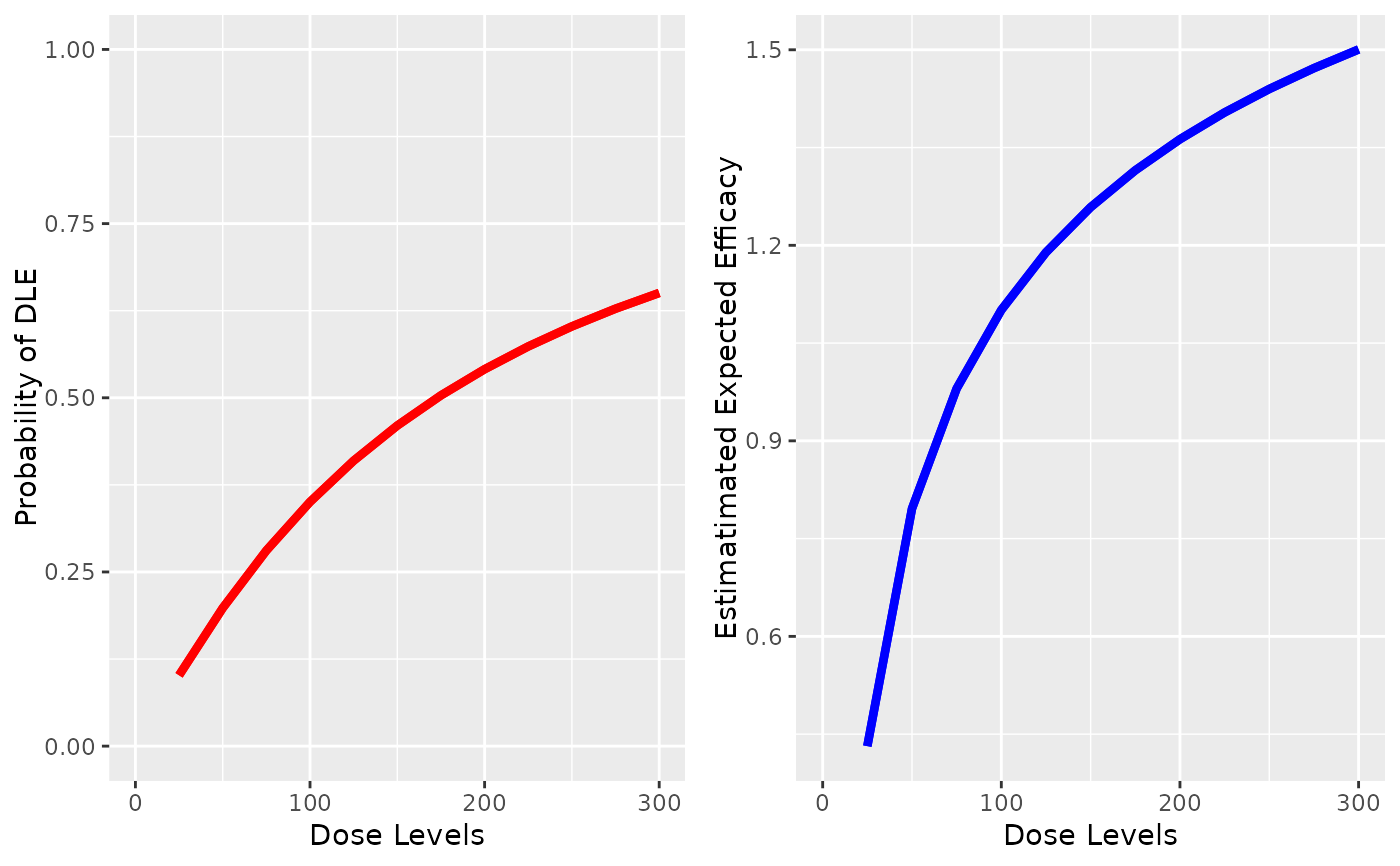
Plot of the DLE and efficacy curve side by side given a DLE pseudo model, a DLE sample, an efficacy pseudo model and a given efficacy sample
Source:R/Samples-methods.R
plotDualResponses.RdPlot of the DLE and efficacy curve side by side given a DLE pseudo model, a DLE sample, an efficacy pseudo model and a given efficacy sample
Plot of the dose-DLE and dose-efficacy curve side by side given a DLE pseudo model and a given pseudo efficacy model without DLE and efficacy samples
Usage
plotDualResponses(DLEmodel, DLEsamples, Effmodel, Effsamples, data, ...)

# S4 method for class 'ModelTox,Samples,ModelEff,Samples'
plotDualResponses(
  DLEmodel,
  DLEsamples,
  Effmodel,
  Effsamples,
  data,
  extrapolate = TRUE,
  showLegend = FALSE,
  ...
)

# S4 method for class 'ModelTox,missing,ModelEff,missing'
plotDualResponses(DLEmodel, DLEsamples, Effmodel, Effsamples, data, ...)
Arguments
- DLEmodel
the pseudo DLE model of
ModelToxclass object- DLEsamples
the DLE samples of
Samplesclass object- Effmodel
the pseudo efficacy model of
ModelEffclass object- Effsamples
the Efficacy samples of
Samplesclass object- data
the data input of
DataDualclass object- ...
additional arguments for the parent method
plot,Samples,GeneralModel-method- extrapolate
should the biomarker fit be extrapolated to the whole dose grid? (default)
- showLegend
should the legend be shown? (not default)
Value
This returns the ggplot
object with the dose-toxicity and dose-efficacy model fits
Functions
plotDualResponses(
  DLEmodel = ModelTox,
  DLEsamples = Samples,
  Effmodel = ModelEff,
  Effsamples = Samples
)
: function still to be documentedplotDualResponses( DLEmodel = ModelTox, DLEsamples = missing, Effmodel = ModelEff, Effsamples = missing ): Plot the DLE and efficacy curve side by side given a DLE model and an efficacy model without any samples
Examples
# nolint start

## we need a data object with doses >= 1:
data <- DataDual(
  x = c(25, 50, 25, 50, 75, 300, 250, 150),
  y = c(0, 0, 0, 0, 0, 1, 1, 0),
  w = c(0.31, 0.42, 0.59, 0.45, 0.6, 0.7, 0.6, 0.52),
  doseGrid = seq(25, 300, 25),
  placebo = FALSE
)
#> Used default patient IDs!
#> Used best guess cohort indices!
##plot the dose-DLE and dose-efficacy curves in two plots with DLE and efficacy samples
##define the DLE model which must be of 'ModelTox' class
##(e.g 'LogisticIndepBeta' class model)
DLEmodel <- LogisticIndepBeta(
  binDLE = c(1.05, 1.8),
  DLEweights = c(3, 3),
  DLEdose = c(25, 300),
  data = data
)
## define the efficacy model which must be of 'ModelEff' class
## (e.g 'Effloglog' class)
Effmodel <- Effloglog(
  eff = c(1.223, 2.513),
  eff_dose = c(25, 300),
  nu = c(a = 1, b = 0.025),
  data = data
)
##define the DLE sample of 'Samples' class
##set up the same data set in class 'Data' for MCMC sampling for DLE
data1 <- Data(x = data@x, y = data@y, doseGrid = data@doseGrid)
#> Used default patient IDs!
#> Used best guess cohort indices!
##Specify the options for MCMC
options <- McmcOptions(burnin = 100, step = 2, samples = 1000)


DLEsamples <- mcmc(data = data1, model = DLEmodel, options = options)
##define the efficacy sample of 'Samples' class
Effsamples <- mcmc(data = data, model = Effmodel, options = options)
##plot the dose-DLE and dose-efficacy curves with two plot side by side.
##For each curve the 95% credibility interval of the two samples are alos given
plotDualResponses(
  DLEmodel = DLEmodel,
  DLEsamples = DLEsamples,
  Effmodel = Effmodel,
  Effsamples = Effsamples,
  data = data
)

# nolint end
# nolint start

## we need a data object with doses >= 1:
data <- DataDual(
  x = c(25, 50, 25, 50, 75, 300, 250, 150),
  y = c(0, 0, 0, 0, 0, 1, 1, 0),
  w = c(0.31, 0.42, 0.59, 0.45, 0.6, 0.7, 0.6, 0.52),
  doseGrid = seq(25, 300, 25),
  placebo = FALSE
)
#> Used default patient IDs!
#> Used best guess cohort indices!
##plot the dose-DLE and dose-efficacy curves in two plots without DLE and efficacy samples
##define the DLE model which must be of 'ModelTox' class
##(e.g 'LogisticIndepBeta' class model)
DLEmodel <- LogisticIndepBeta(
  binDLE = c(1.05, 1.8),
  DLEweights = c(3, 3),
  DLEdose = c(25, 300),
  data = data
)
## define the efficacy model which must be of 'ModelEff' class
## (e.g 'Effloglog' class)
Effmodel <- Effloglog(
  eff = c(1.223, 2.513),
  eff_dose = c(25, 300),
  nu = c(a = 1, b = 0.025),
  data = data
)
##plot the dose-DLE and dose-efficacy curves with two plot side by side.
plotDualResponses(DLEmodel = DLEmodel, Effmodel = Effmodel, data = data)


# nolint end